FAST Search Thruput Optimization Troubleshooting
The last couple of weeks in September I was tasked to identify the thruput problems with our FAST search environment. Having little experience with FAST management, I had to get up-to-speed rather quickly, and attempt to identify the bottleneck. This post helps to identify how I managed to analyze the state of the environment, deduce where the bottleneck was, and implement a fix.
![]()
The last couple of weeks in September I was tasked with identifying and fixing a problem with our production FAST Search for SharePoint environment: slow crawl rates. Our incremental crawls were taking anywhere between 45 minutes and several hours to run for each cycle, and a full crawl was taking in excess of 65 hours to crawl just under 1 million documents. Atrocious. I had little previous experience administering FAST search environments, and by the end of this process, I feel like a solid power administrator (but still by no means an “expert”). This post is meant to share my thought process, findings, resources, and other information available to me to help identify the bottlenecks and implement a fix to this problem.
About FAST Search for SharePoint (FS4SP)
FAST Search was originally developed by a company called FAST Search and Transfer and was acquired by Microsoft in 2008. The acquisition was a strategic move on Microsoft’s part to enter the enterprise search market. Although Microsoft had their own search products (Microsoft Search Server and Search Server 2010), the scalability and feature sets provided with FAST Search far outweigh that of Microsoft’s search products. Unfortunately, these extra features come at a premium, but are truly necessary if you really want a rich search experience for users.
Architecturally, FAST search components are very easy to configure and scale out to increase not only query thruput, but also crawling and indexing thruput and capacity. This is done by using a matrix configuration where servers are arranged into rows and columns. When you read the technical documentation, by adding rows, you increase redundancy of services, but also query capacity. However, when you add columns, you increase indexing capacity and thruput. Discussing the nuances of search rows and columns is another blog post in itself, so I’ll leave that for a future post.
Beyond simply adding servers to rows and columns, deciding which servers host which services involved in the content pipeline is extremely easy. All it takes is a configuration file change and issuing a single command across all servers in the FAST farm. You can also have multiple instances of the services to provide load balancing and high availability. How this works is also worthy of another blog post.
The following is how our environment is architected:
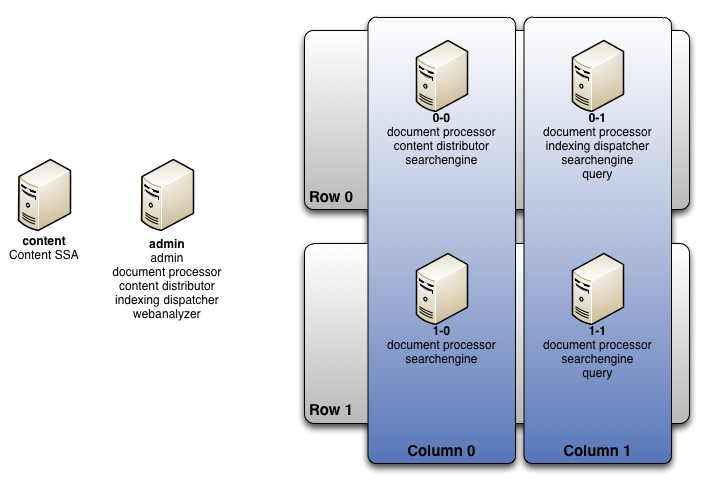
This is a fairly typical environment, where we are taking advantage of two rows of indexers for high availability, with two index columns for expanded capacity. Document processing is spread out over all servers to have more than enough pipeline bandwidth to constantly work on the large volume of content that our crawlers will be sending to our environment. Finally, these servers have 12 cores, 32G of RAM, and two GigE nics in a teaming configuration: more than beefy enough servers to quickly chew through the massive amount of content expected to be thrown its way.
The Problem
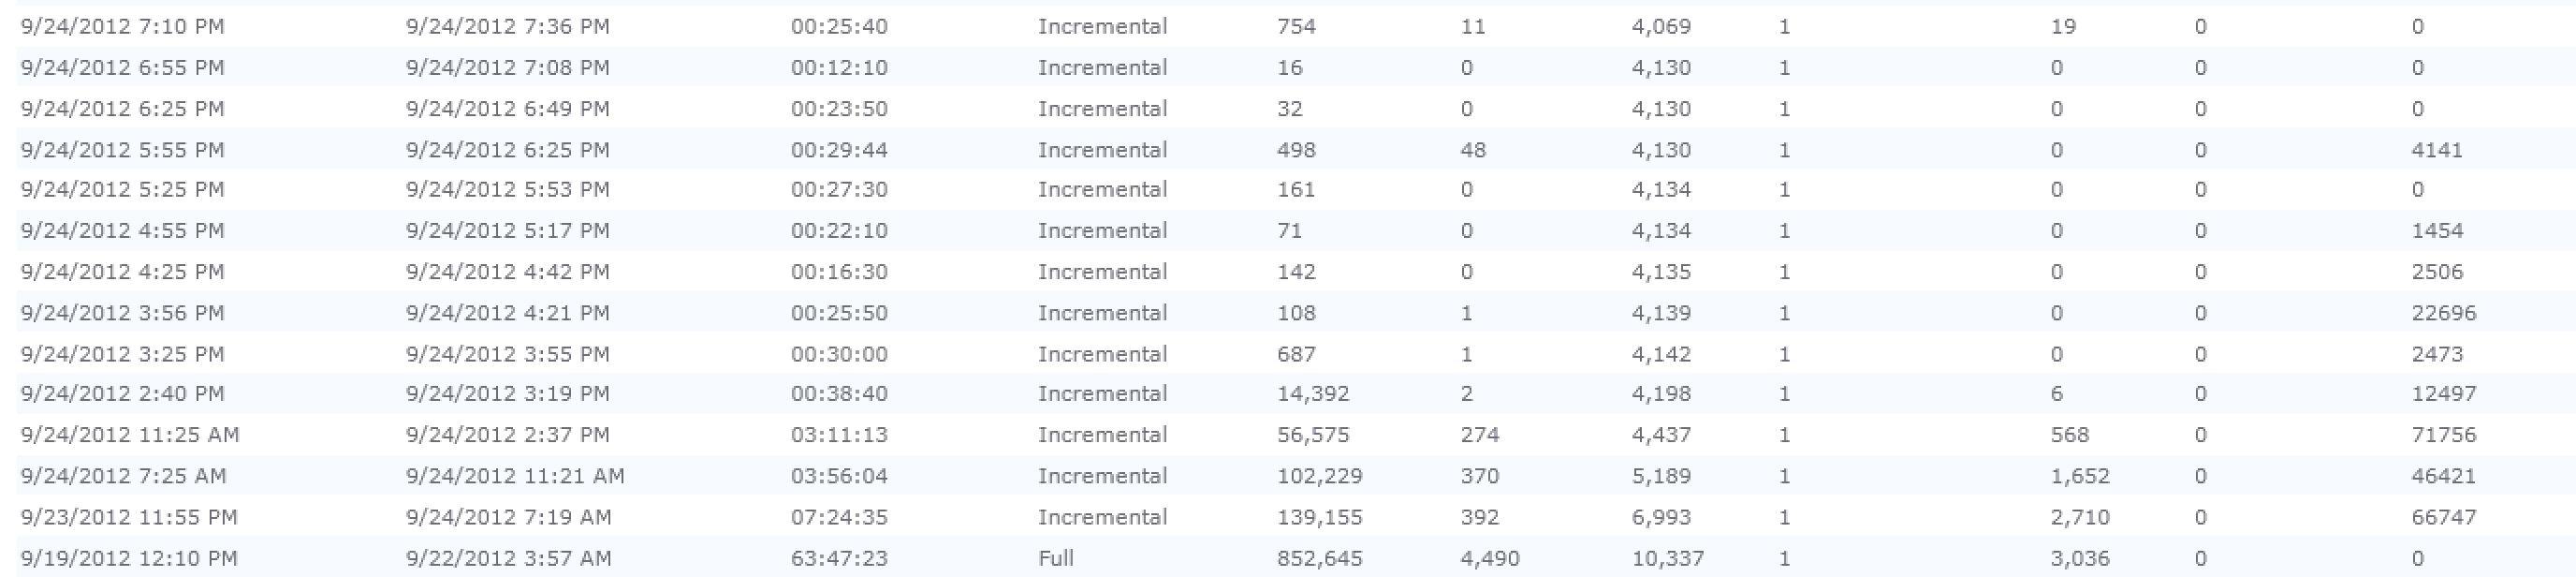
Our crawl rate was atrocious. The last full crawl took 63:47:23 to crawl 870K+ items - an effective crawl rate of 3.78 documents per second. Incremental crawls were taking in excess of 20 minutes each. This didn’t make much sense given the horsepower that we had in our FAST and SharePoint environment. So, I was tasked with trying to get this crawl rate improved. But first, I had to learn how to administer a FAST environment.
Brain Food - The Books I Used
One of the first books that I picked up was Professional Microsoft Search: FAST Search, SharePoint Search, and Search Server (ISBN 978-0-470-58466-8). I read the majority of the book, but eventually stopped. This book is not very technically-oriented. It gives a great overview of the differences between the OOB SharePoint Search, Microsoft Search Server, and FAST Search. It provides screenshots and basic information on how to install FAST. It also provides the theory behind capacity planning and architecture, and considerations when building search-based applications. Ultimately, however, tips and information on how to administer the environment and identify bottlenecks was woefully inadequate.
The next book I started to read was Working with Microsoft FAST Search Server 2010 for SharePoint. After cracking open this book, I was much more pleased and found more information on the various powershell commands and executables provided by FAST. In fact, one of the most important resources was a series of links I was able to find throughout the book that point to different pages on TechNet. These pages include the tools and other detailed information necessary to administer the FAST environment:
- FAST Search PowerShell Commandlets
- FAST Search for SharePoint Command-Line Tools
- Performance Counters
- Performance and Capacity Monitoring
One of the best resources I found was on YouTube, titled Troubleshooting FAST Search and the SharePoint Crawler - An Operational Viewpoint by Kristopher Loranger from Microsoft. One of the best tidbits in the video was this: a good crawl rate should be between 45 and 60 documents per second. So, I had a goal to shoot for. But, most importantly, he gave a simple trick to help identify where the bottleneck is: temporarily suspend indexing. By suspending indexing and performing another full crawl, you can identify whether the problem is on the SharePoint infrastructure, or on the FAST infrastructure side. If there is speedup after suspending indexing, the problem is FAST. Otherwise, the problem is SharePoint. A pretty simple technique to keep in your back pocket.
The best article I found on the TechNet site was that on Performance and Capacity Monitoring. This told me specifically which performance counters to monitor, and how to use that information to identify bottlenecks. I kept referring back to this article when setting up Performance Monitor on each of the various servers.
Interesting FAST Search Log Entries
While looking through and gathering information that could be used to identify any bottlenecks in our environment, I decided to look at the FAST admin server logs in <FASTInstall>\var\log\all.log. In there, I noticed a significant number of the following entries:systemmsg: Subsystem operation call timeout (session 3, ops 558->558), sleeping 84 seconds before resubmitting operation set
systemmsg: Subsystem operation call timeout (session 3, ops 551->551), sleeping 47 seconds before resubmitting operation set
systemmsg: Subsystem operation call timeout occured 3 times, sending callback
systemmsg: Subsystem operation call timeout occured 3 times, sending callback
systemmsg: Subsystem operation call timeout occured 3 times, sending callback
systemmsg: Subsystem operation call timeout occured 3 times, sending callback
This was a significant problem during the full crawl. In fact, 15MB of those log entries kind of a problem. It was happening roughly once a second. Ultimately, what confused me about those log entries was the fact they were logged at an INFO log level - not warning or error. Call timeouts that occur that frequently should indicate some significant problem - but where? Was it a network problem, a processing problem, or some configuration problem? My gut reaction was to consider this a network problem, but I needed more statistics to be able to more acutely identify the elements influencing this problem.
Performance Monitor - Knowledge is Power
As mentioned above, I kept referring back to the Performance and Capacity Monitoring document on Microsoft TechNet and proceeded to setup monitors in Performance Monitor. The following explains what I setup on each of the servers in the environment.
- Content SSA / Crawler
- Batches Ready (OSS Search FAST Content Plugin)
- Batches Submitted (OSS Search FAST Content Plugin)
- Processor % (Processor)
- Bytes Total/sec (Network Interface)
- Content Distributors
- Document Processors (FAST Search Content Distributor)
- Document Processors Busy (FAST Search Content Distributor)
- Average Dispatch Time (ms) (FAST Search Content Distributor)
- Bytes Total/sec (Network Interface)
- Indexers
- Current Queue Size (FAST Search Indexer Status)
- FiXML Fill Rate (FAST Search Indexer)
- Active documents (FAST Search Indexer Partition)
- Bytes Total/sec (Network Interface)
Understand the Data Flow before Understanding the Statistics
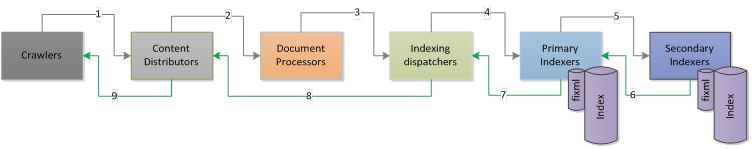
Before we began to look at the statistics, it’s important to understand how the content flows from end-to-end. A problem earlier in the content pipeline can manifest bad / inappropriate metrics further down the line. So, identifying the bottleneck where it really is (as early as possible) is truly important. The steps of content processing is best represented by this image found on TechNet:
Let’s take a look at a few of the metrics I managed to gleam from these performance metrics.
Content Search Service Application / Crawler
Per our architecture, we have only a single crawler component. So, getting a sense of how much content the Content SSA is pushing to the Content Distributors is the first step in the process. Again, if you refer back to the diagram of the content processing pipeline, sending data from the crawler to the document processor is the first step. So, let’s look at the network diagrams for this server:
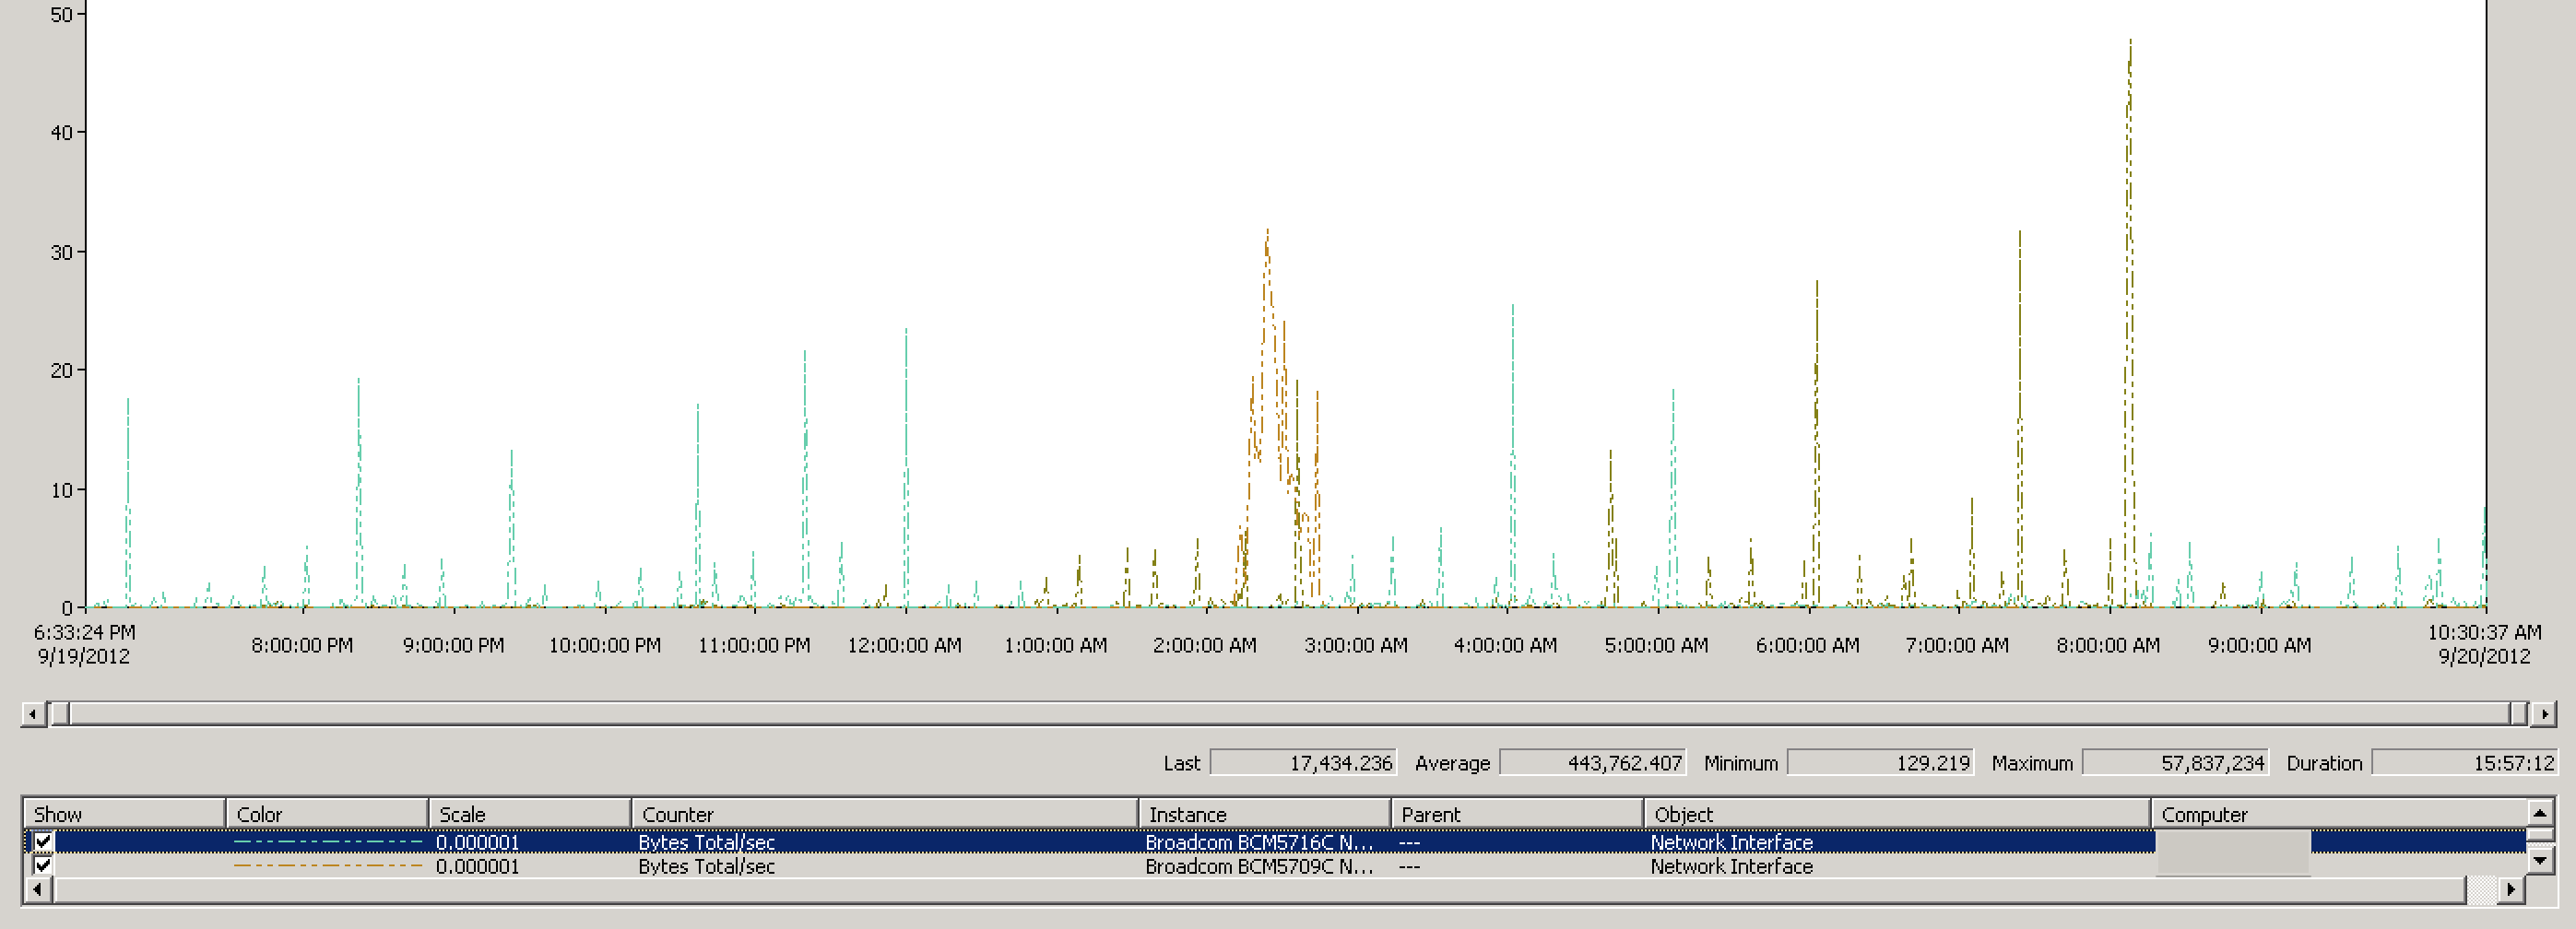
We are looking at two network interfaces as there is not a consolidated performance counter for the “virtual” paired interface that Broadcom creates for us. Therefore, I have to look at each of the network interfaces. Nevertheless, you can see that the peak network traffic for this server was roughly 57 MBps, averaging at only 443 KBps. This isn’t really high thruput considering the dual paired GigE network interfaces on this server.
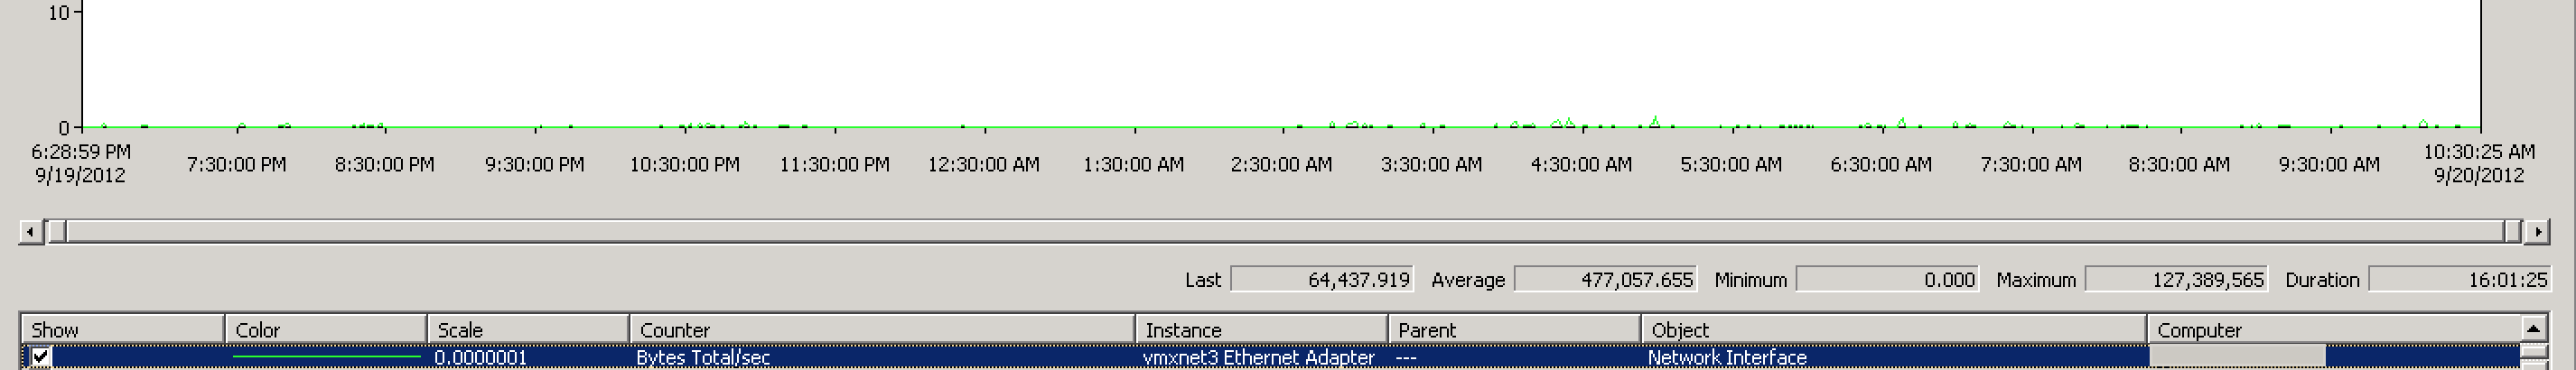
If we look at the network traffic on the admin server, it echos that of the Content SSA - low network thruput (peak traffic 127 MBps, averaging around 477 KBps):
So, while this is looking like a network bottleneck, it’s still important for us to look at the other statistics. Unfortunately, I don’t have screenshots of the next important statistic: Batches Ready. I found that when looking at that statistic, it rose sharply and remained high throughout the crawl - in excess of 15K items, regularly refilling after dropping to about 7-8K. What this meant was the crawler was able to chew through data faster than the FAST search environment was able to process it. If Batches Ready was close to or at 0, then that would mean the crawler could not keep up with the FAST search processing. So, this news made me question whether I was on the proper path hunting down a network issue.
However, this did not rule out the possibility of a network problem. I was able to look at the Batches Submitted statistic and find that it was very low. This is indicative of some bottleneck (either network or disk), as the content server should have been able to push all of the batches as soon as they were ready. But, the amount being submitted during each cycle was dismal - less than 100 batches per cycle.
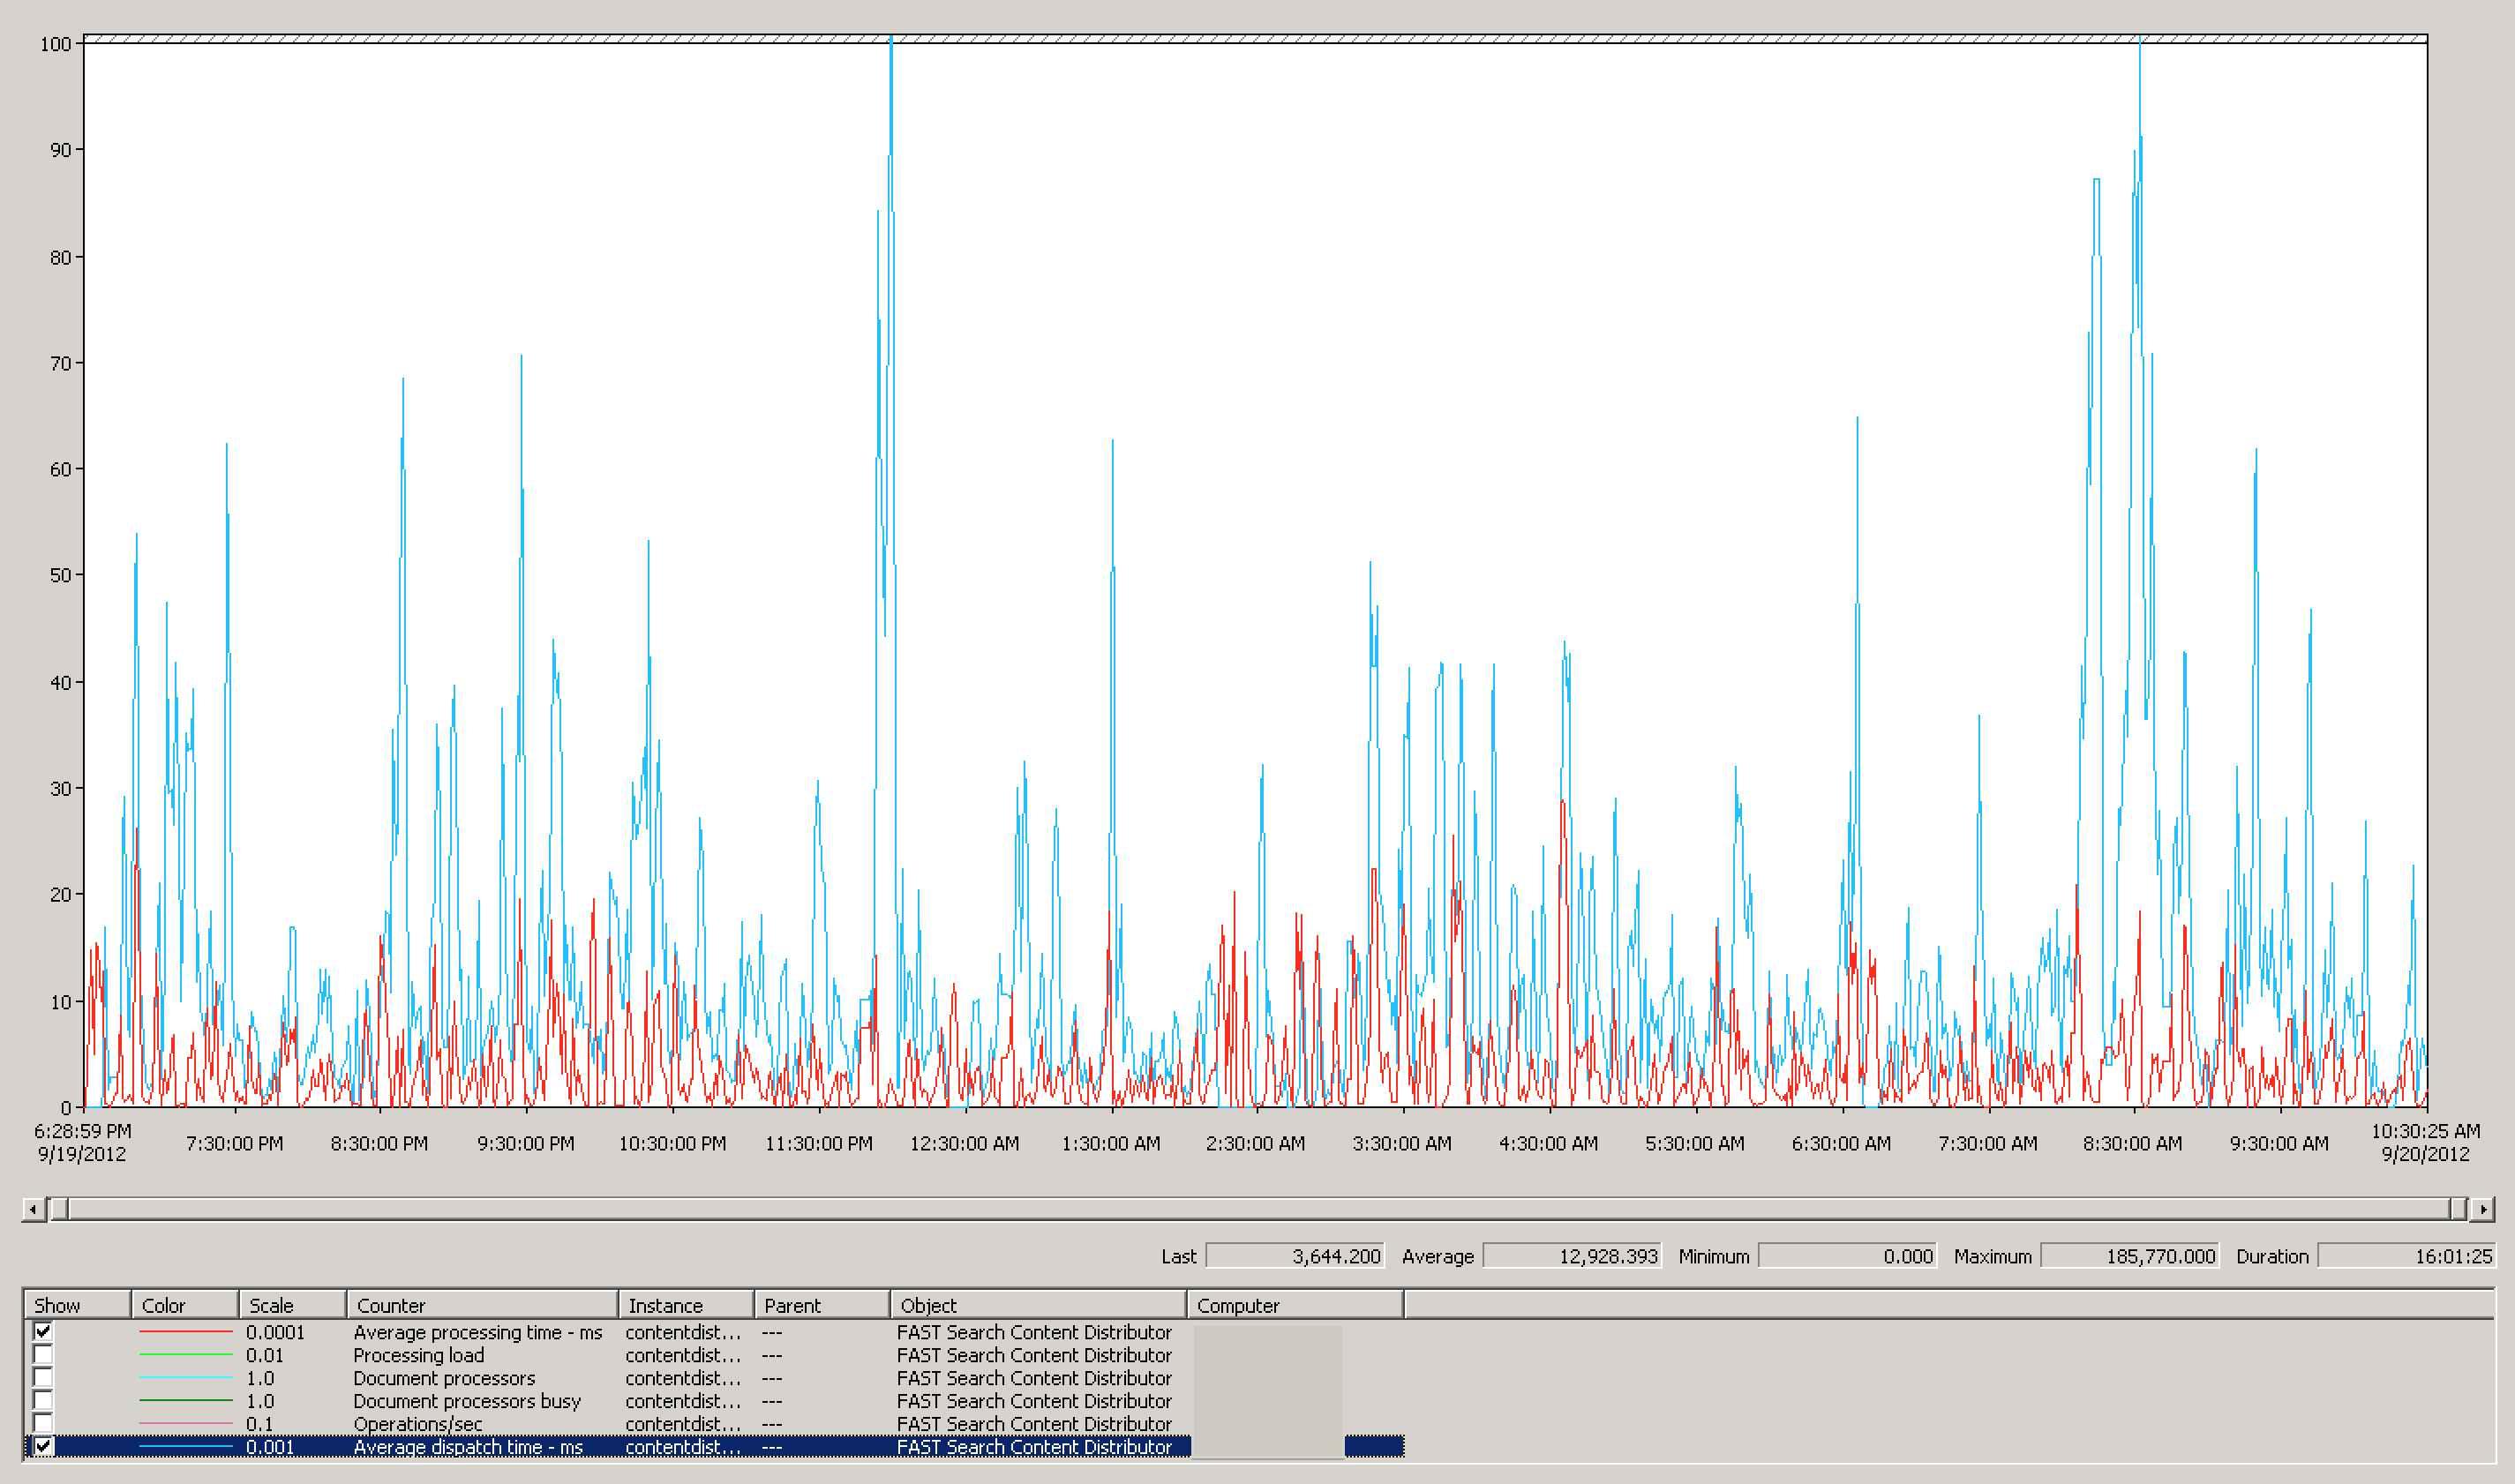
So, let’s switch over to the Document Dispatcher to figure out what may be going on there. Again, continuing with my hunch, I wanted to look at the Average dispatch time. This is solidly a network bottleneck monitor, and the results below further my suspicions. Average dispatch times were in excess of 12,900 ms. According to Microsoft, dispatch times over 10 ms indicate network congestion.
Of course, an obligatory look at the document processors in-use is necessary. Disappointingly, we were not using even half of our document processors on average. But, this is likely because we can’t feed enough content fast enough to the servers, leaving the document processor threads idle, waiting for work. An easy way of double checking the values below is to run the following command from command line:psctrl status
This will show the status of all document processors in the farm. Based on the graph below, most times when I was checking that, most DPs were idle. However, just because we had a little under half working at seemingly all times, they weren’t doing much. This metric is literally either an indicator that a DP is working or it’s not. If you dig into the workload by using the command above, you’d have found that most servers were only processing between 4 and 5 documents at a time. Looking at the CPU utilization of each of the document processing servers, I was barely exceeding 30% usage because of this lack of processing.
As I continued to look at the other metrics (like processor, network, disk), it became increasingly apparent that those metrics were deficient due to the lack of sufficient content reaching the servers. I continued to search the internet for recommendations, and finally managed to come across…
The Solution
The solution actually came in the form of two Microsoft articles: one on TechNet, the other on the Microsoft KnowledgeBase site. I finally managed to walk down the hierarchy of articles on the FAST Search Server 2010 for SharePoint documentation to the Troubleshooting section. Inside, there was an article titled Crawling: Slow crawling and slow copying between the indexer and the search nodes. This indeed identified the problems that I surmised: the network was the bottleneck.
In reading about the solution, it recommended that I turn off Network Task Offloading. This was down at a hardware level that I had never really learned, despite my systems administration experience. In essence, Network Task Offloading helps ensure the responsibilities of initiating and validating network traffic between systems is delegated to the network controller hardware rather than the CPU. It makes sense: I want specialized controllers (network controllers, audio controllers, video controllers) to be responsible for processing the data they were specifically created to process. However, as the TechNet article mentions, Task Offloading causing slow crawl problems is typically seen in virtualized environments, and for good reason. In a virtual environment, the VM does not have direct access to the network controller. Instead, it’s provided with a virtual adapter. If the virtualization kernel doesn’t know to translate requests to that virtual adapter to the physical network controller, then inevitably the CPU gets the responsibility of processing those requests - at a significant premium over just telling the CPU to do it in the first place.
However, that was only part of the solution. When I continued to search, I came across a Microsoft KnowledgeBase article titled You cannot crawl or index SharePoint sites in FAST Search Server 2010. This article referenced not only Network Task Offloading, but also TCP Chimney Offload. Ultimately, I loved that the KnowledgeBase article explained why these two things were bad for the FAST Search environment: IPSEC. IPSEC is implemented at Layer 3 (Networking Layer) of the OSI model. As a result, having TCP connections offloaded to hardware, unfamiliar with the security policies in place, will result in improper network activity.
Though the solution was straight-forward, it took me about 10 minutes per box to impelment. Do the following steps to all of your FAST servers as well as your Content SSA servers (crawlers):
Disable TCP Chimney Offload and Task Offload
Open a command prompt on your server as an administrator (make sure to use Run as Administrator if UAC is in effect). Then, run the following commands:netsh int tcp set global chimney=disabled
netsh int ip set global taskoffload=disabled
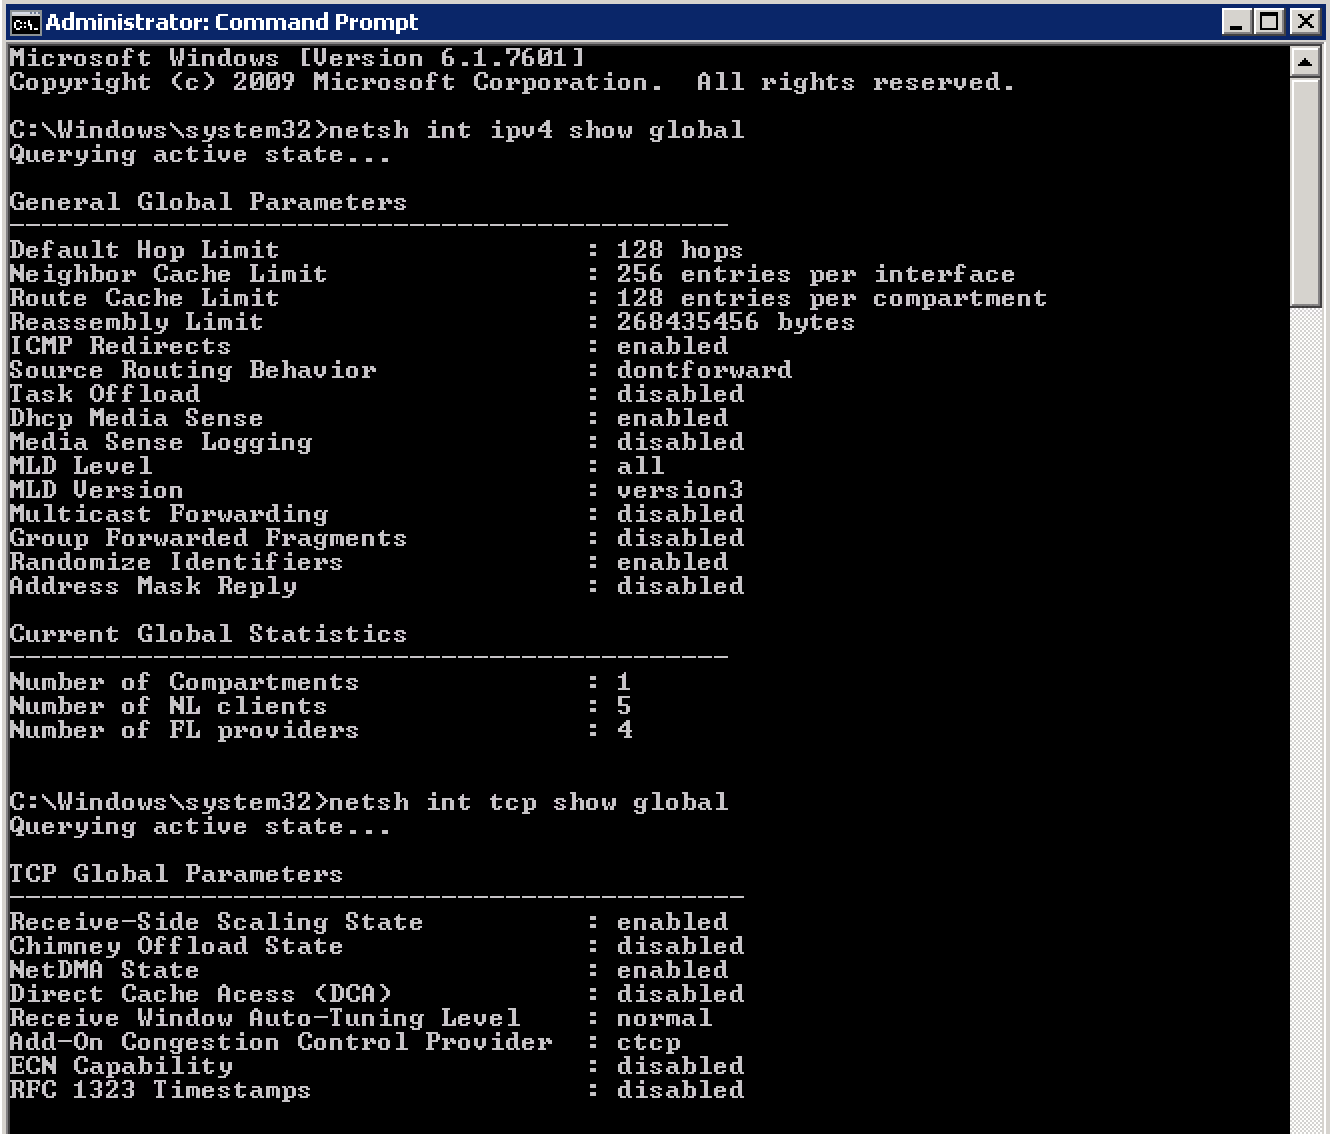
You can then verify those are disabled with the following commands:netsh int tcp show global
netsh int ipv4 show global
Disable Checksum and Large Send Offload at Hardware Level (for Physical Servers)
If you are not using Virtual Machines, you need to check the hardware-level configuration of each of your network adapters. In my case, we were using a Dell Server complete with Broadcom GigE network adapters which had to be configured through it’s proprietary Broadcom Advanced Control Suite 3. I went through each of the network adapters in that interface and found the following settings:

Then, I had to check the server-level configuration for Checksum Offload and ensure it was set to disabled:
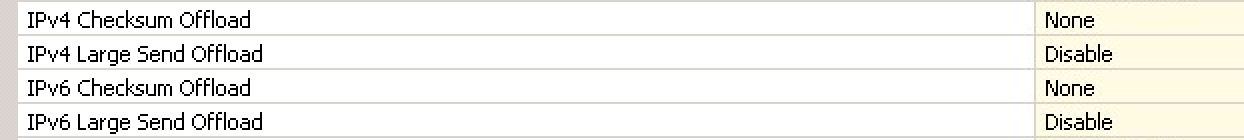
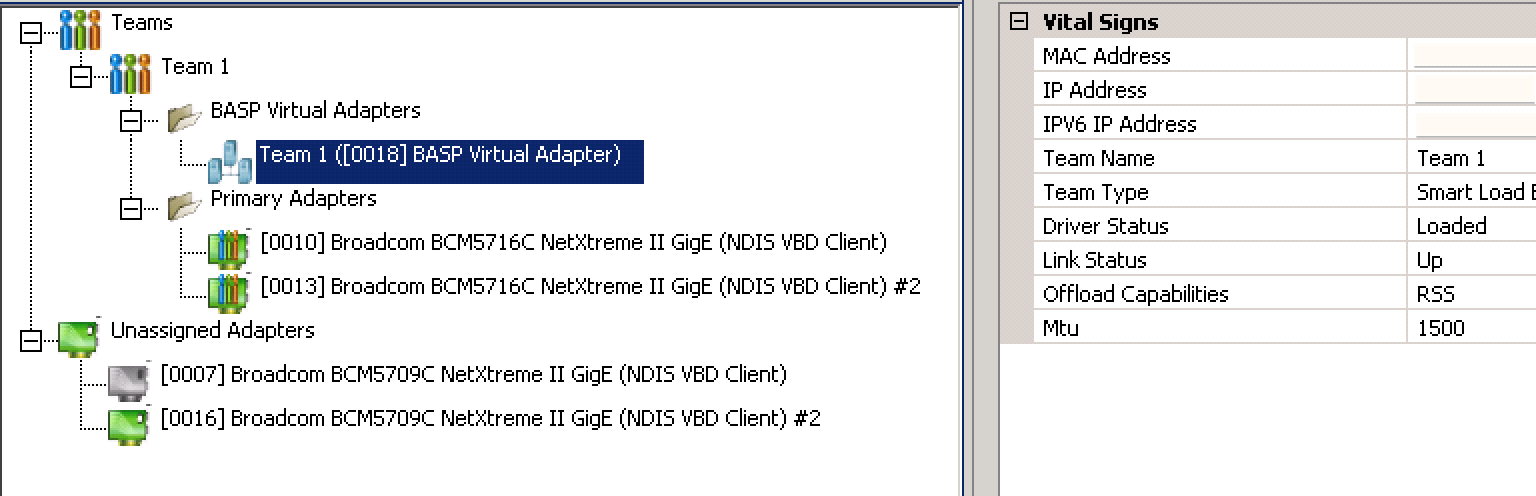
Finally, our systems administrators setup teaming across our network adapters for high availability and load balancing. I double checked the teaming configuration that IPv4 Checksum Offload and IPv4 Large Send Offload were not enabled. Thankfully, once I disabled those features on each of the network cards, the software was intelligent to disable that at the teaming level. However, it would be a good idea that you double check to make sure that your network card does the same:
Reboot the Server
This one is patently obvious. Once you muck with these network settings, you need to reboot to make sure they take effect.
Results
After making all of these changes, I started another full crawl to see if that made any bit of difference. At the completion of the full crawl, a total of 936872 results in 3:28:47 for an effective rate of 74.788 documents per second. This is an increase of nearly 20 fold, an amazing improvement, and well exceeding the desired crawl rate. To look at the results, let’s start from the beginning and look at the networking charts on the crawl server:
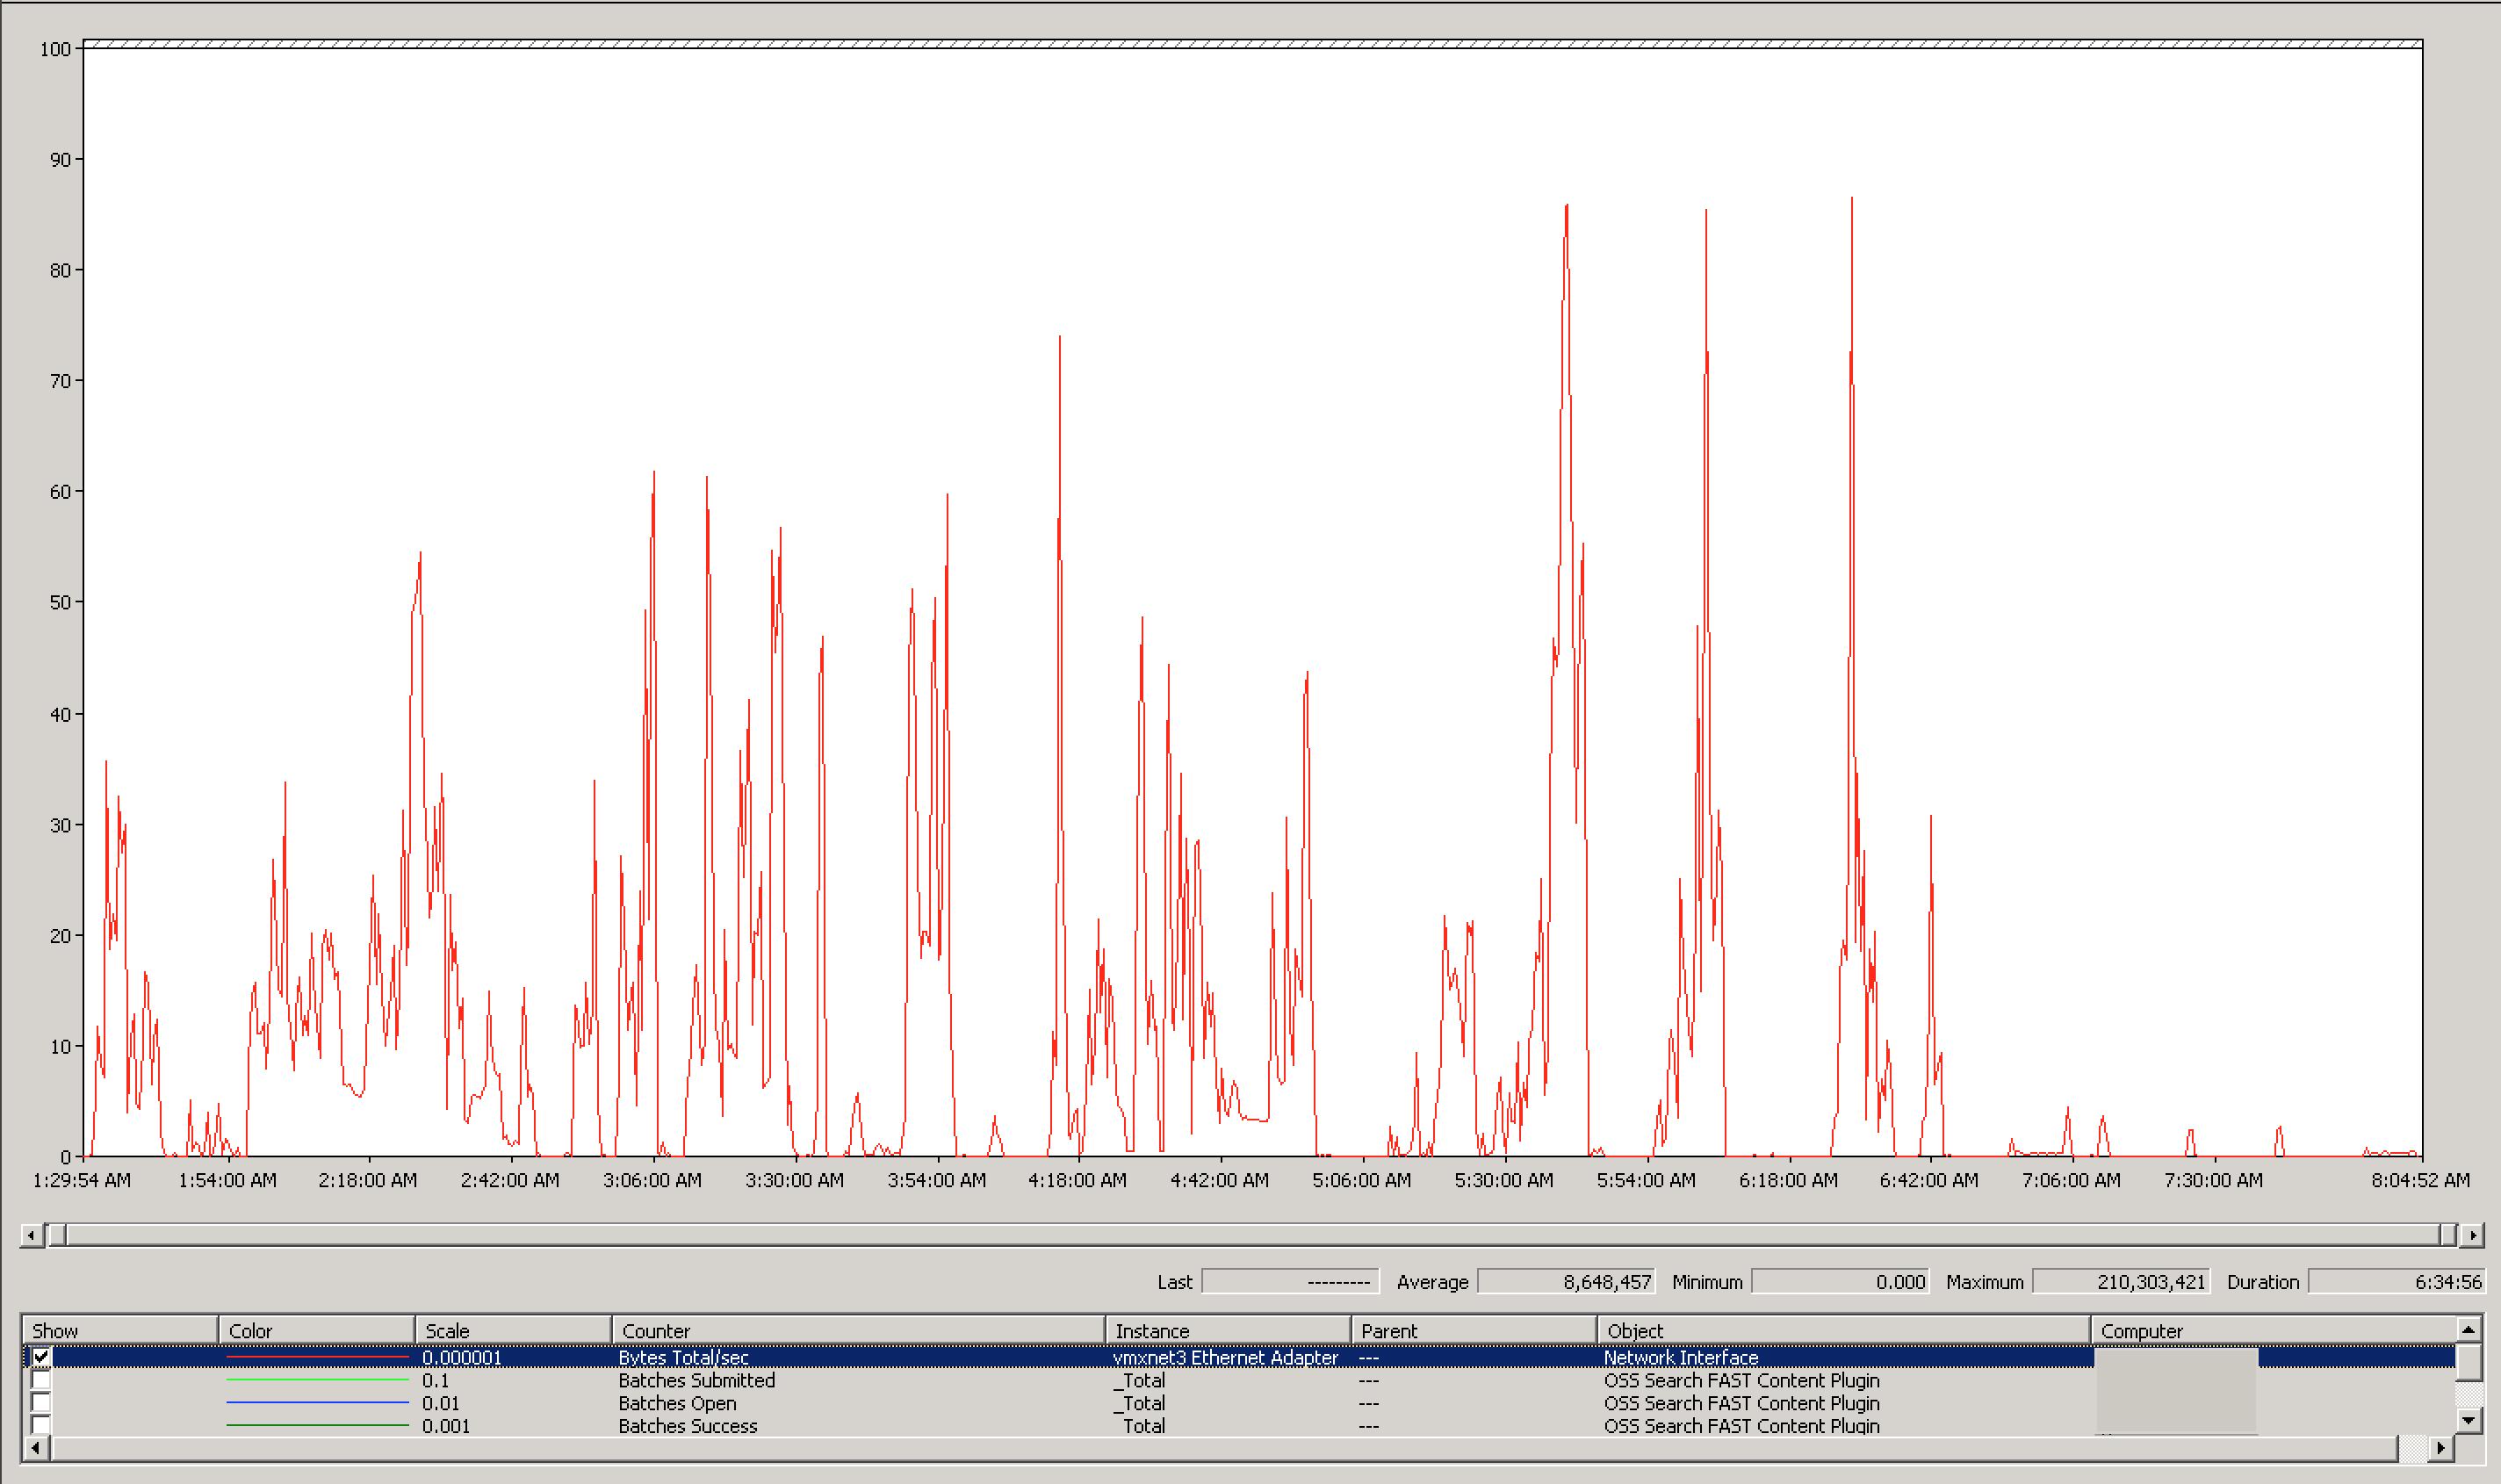
In looking at the Content SSA updates, the maximum thruput was 210 MBps, and the average was 8 MBps! A great speedup. That’s a sufficient level of network traffic, so let’s check out the admin network traffic.
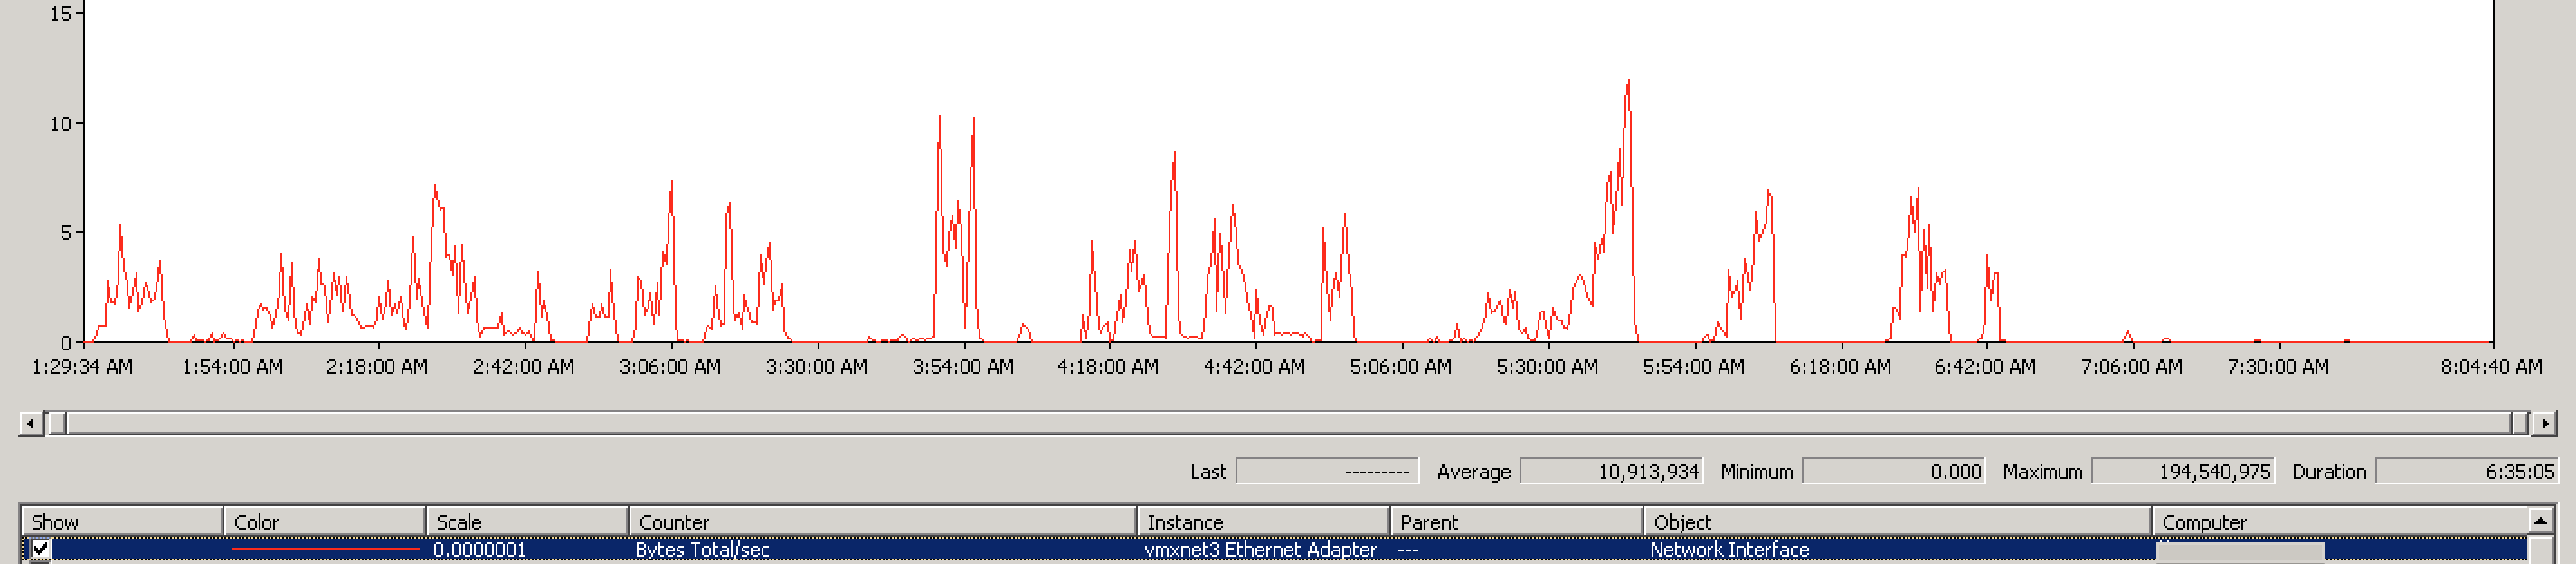
While the graph is less than menacing, the numbers don’t lie: maximum thruput of 194 MBps and an average thruput of 10.9 MBps. Also significant speedup. Knowing that the content over the network seems to be flowing well, let’s see how the crawl server’s queue looked:
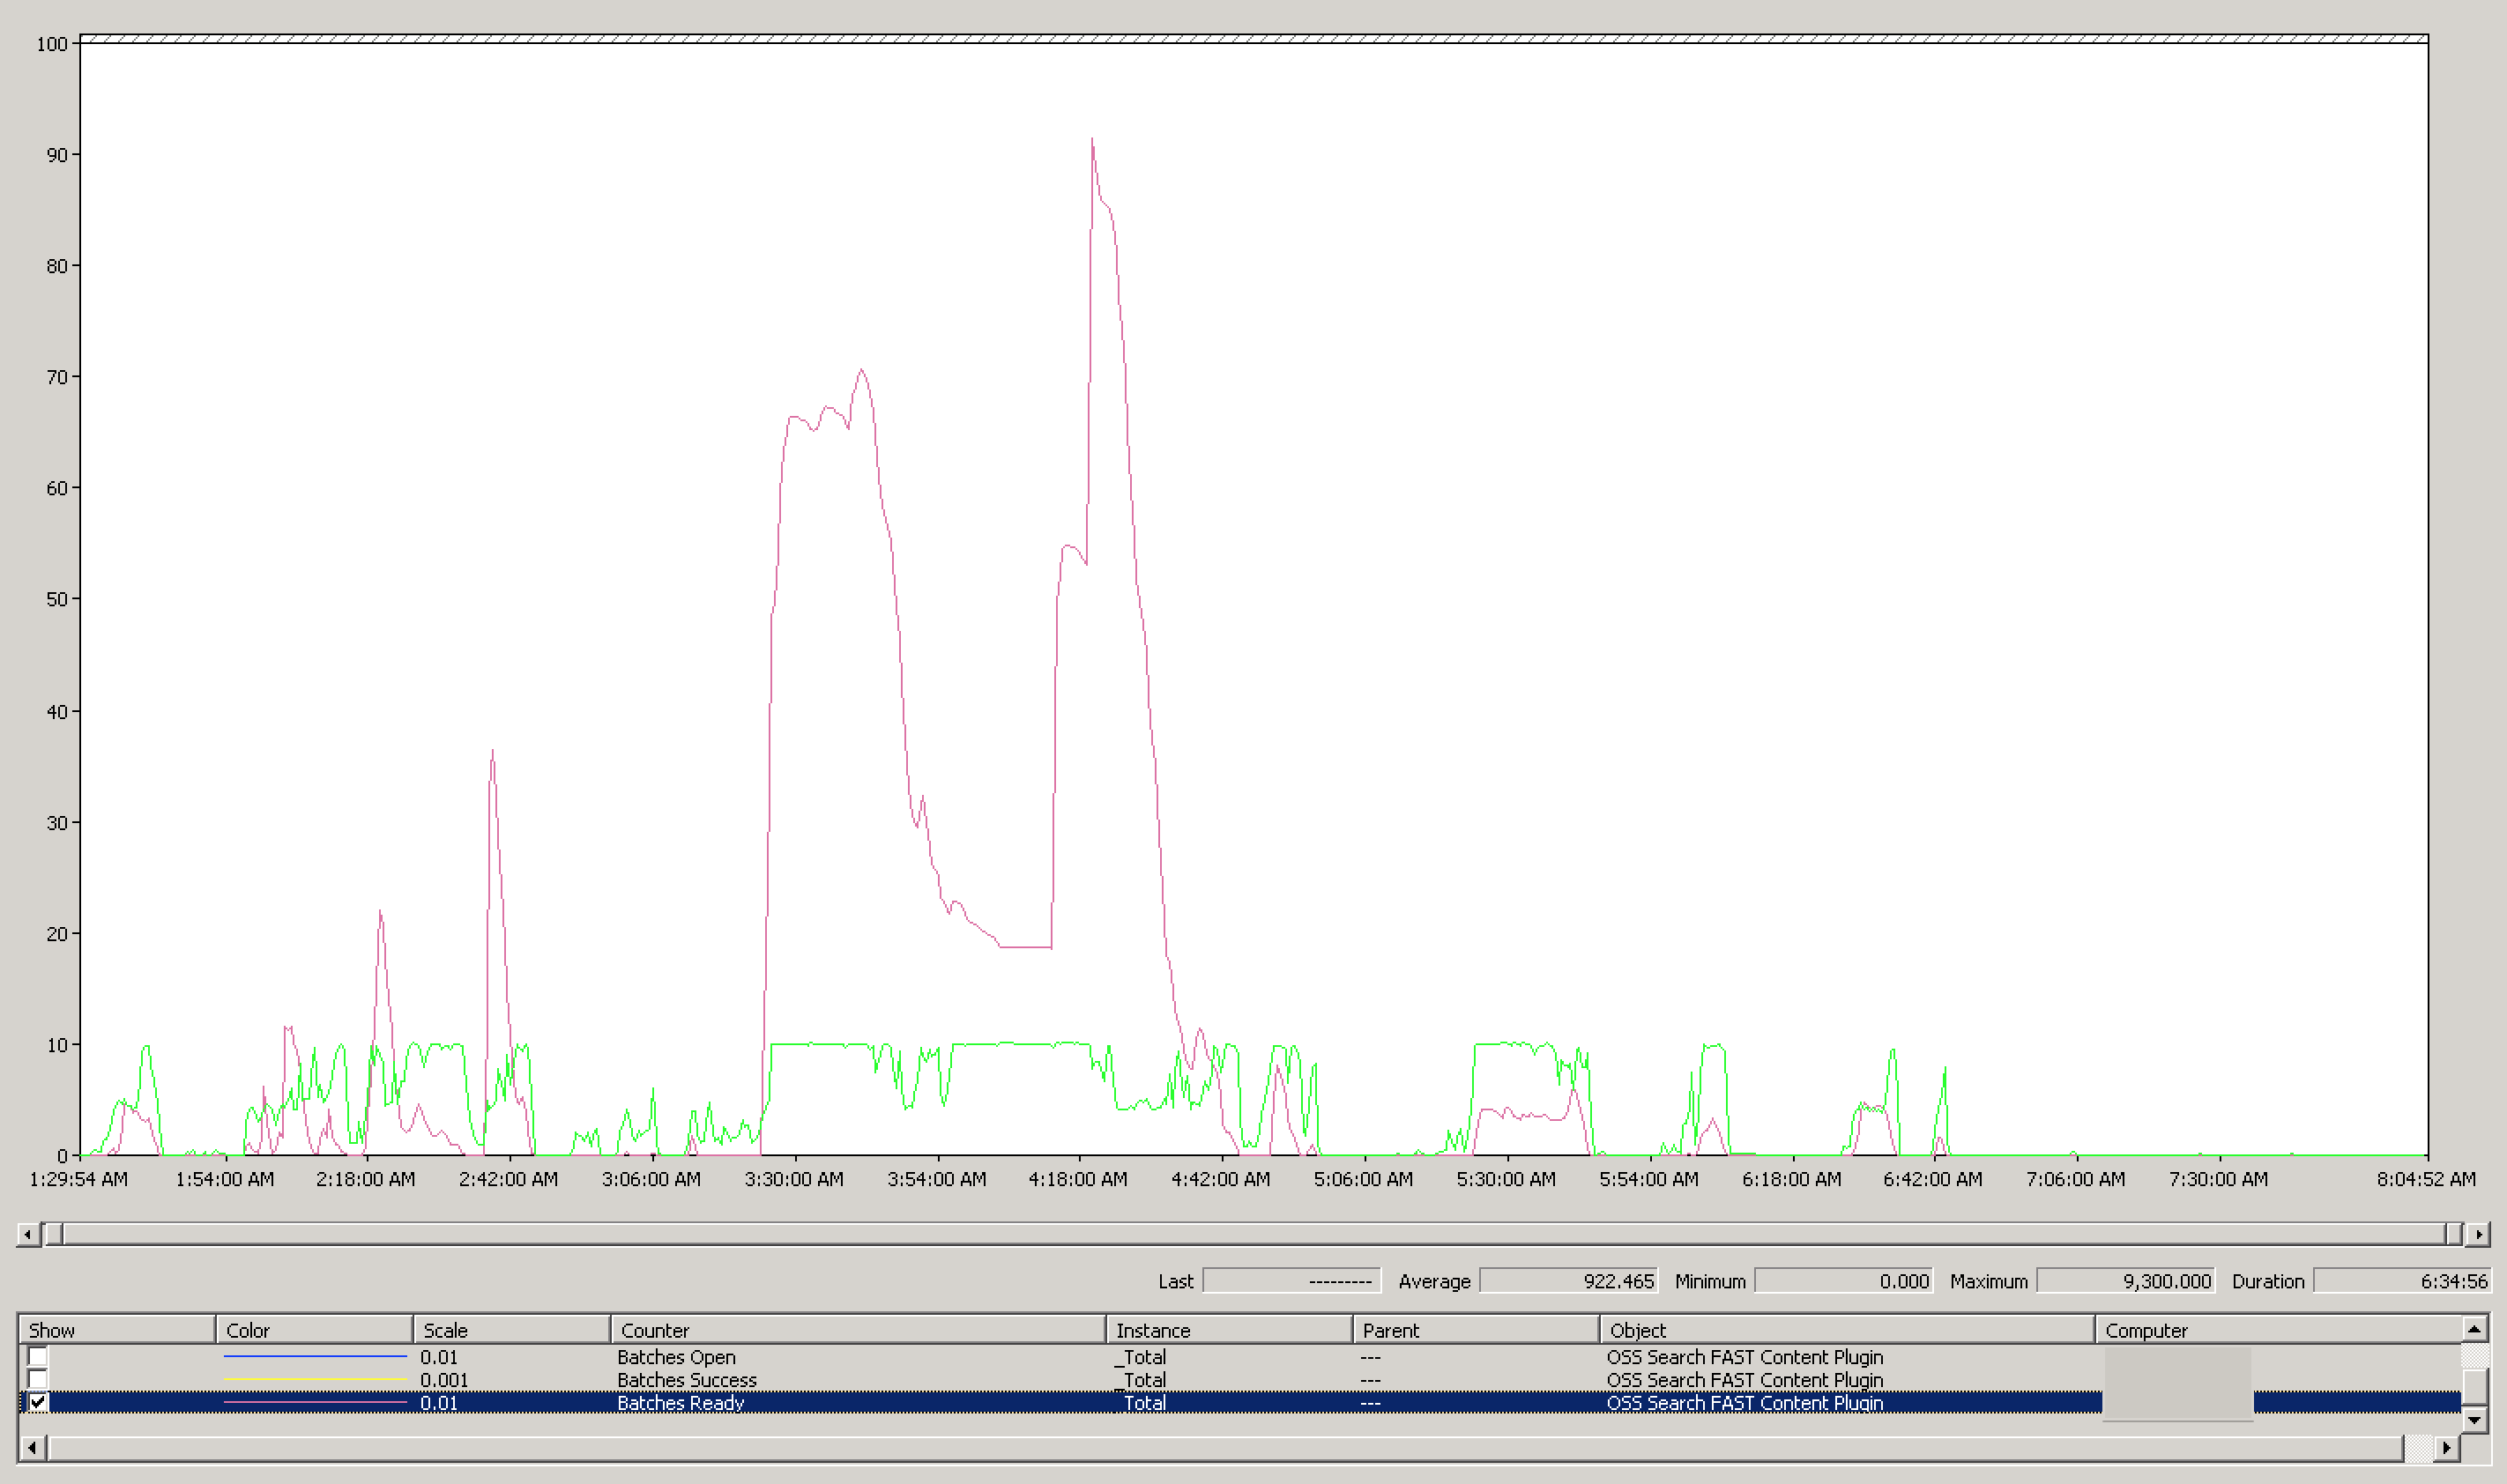
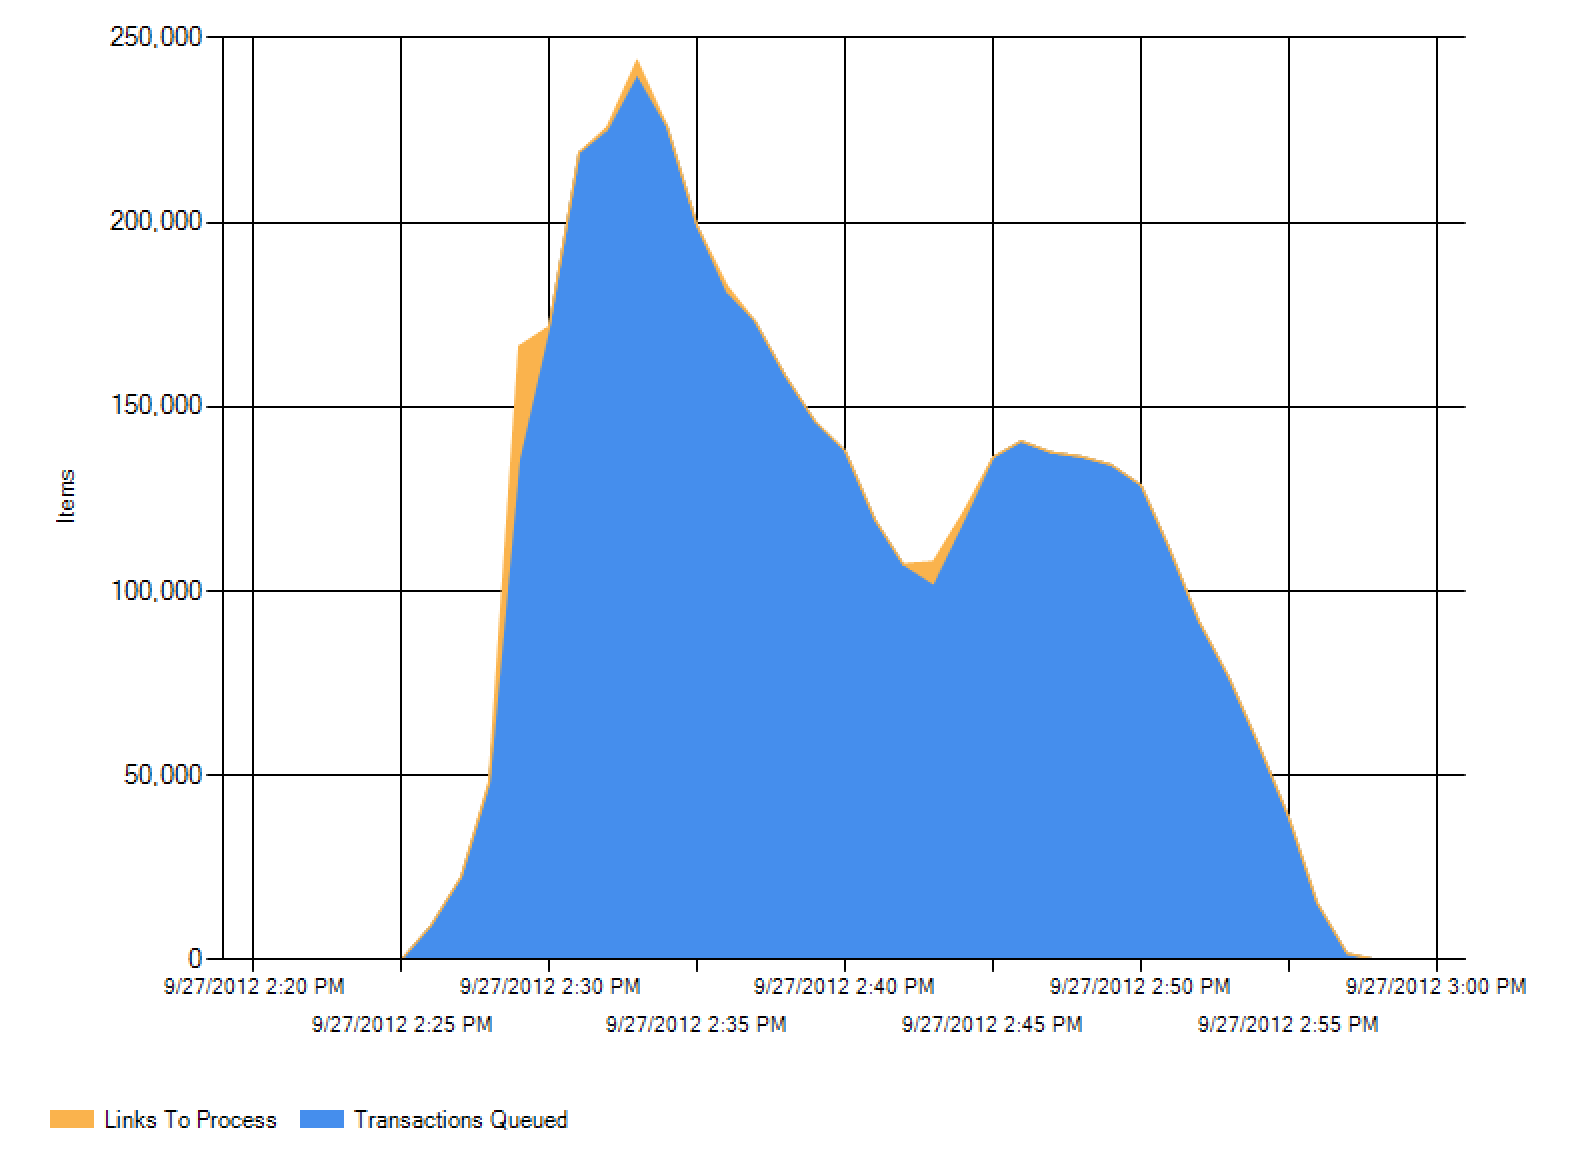
The peak was still higher than I would like, but still much improved compared to previous: 9300. Considering the average was 922 batches ready for dispatch, I’m more than happy with that level of improvement. Let’s check out our document processor utilization:
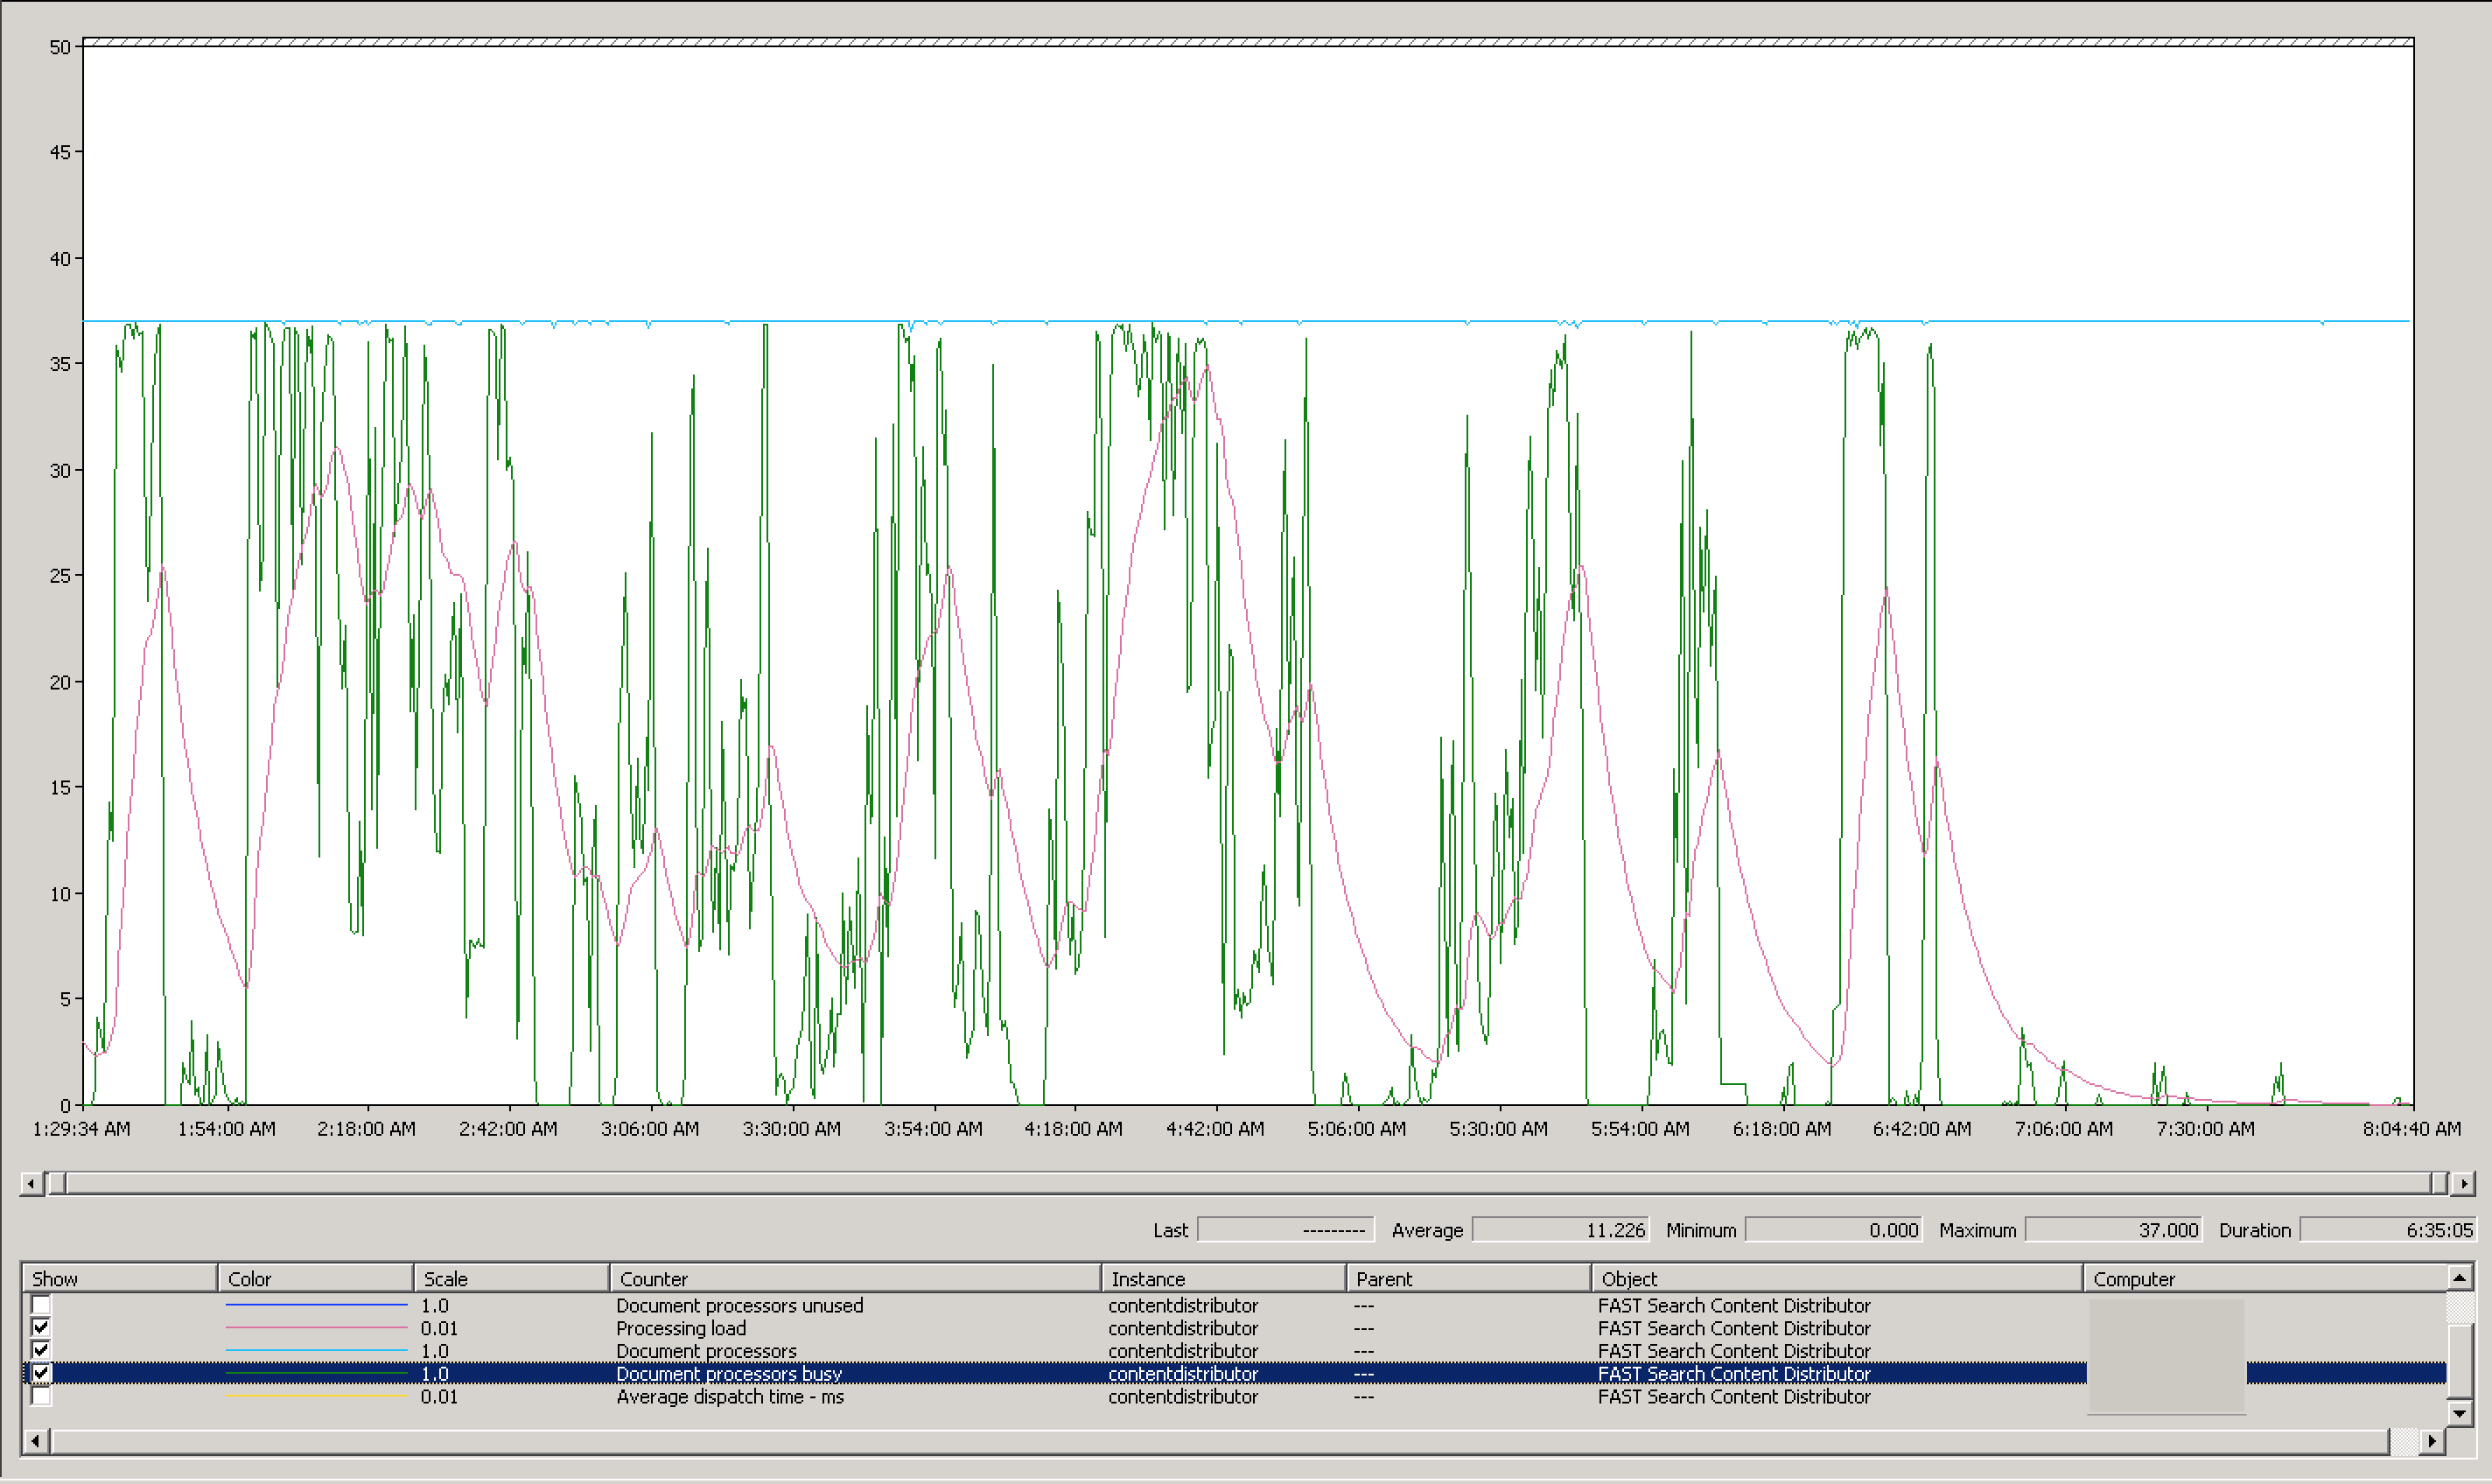
You’ll notice we have the same number of document processors available as previously: 37. However, what you’ll also notice is at several points we had all document processors busy - none were idling. This typically occured as the processing load increased, and died off as the document processors completed processing. To verify that we were feeding content quickly enough to do the document processors, let’s take a look at our dispatch rate:
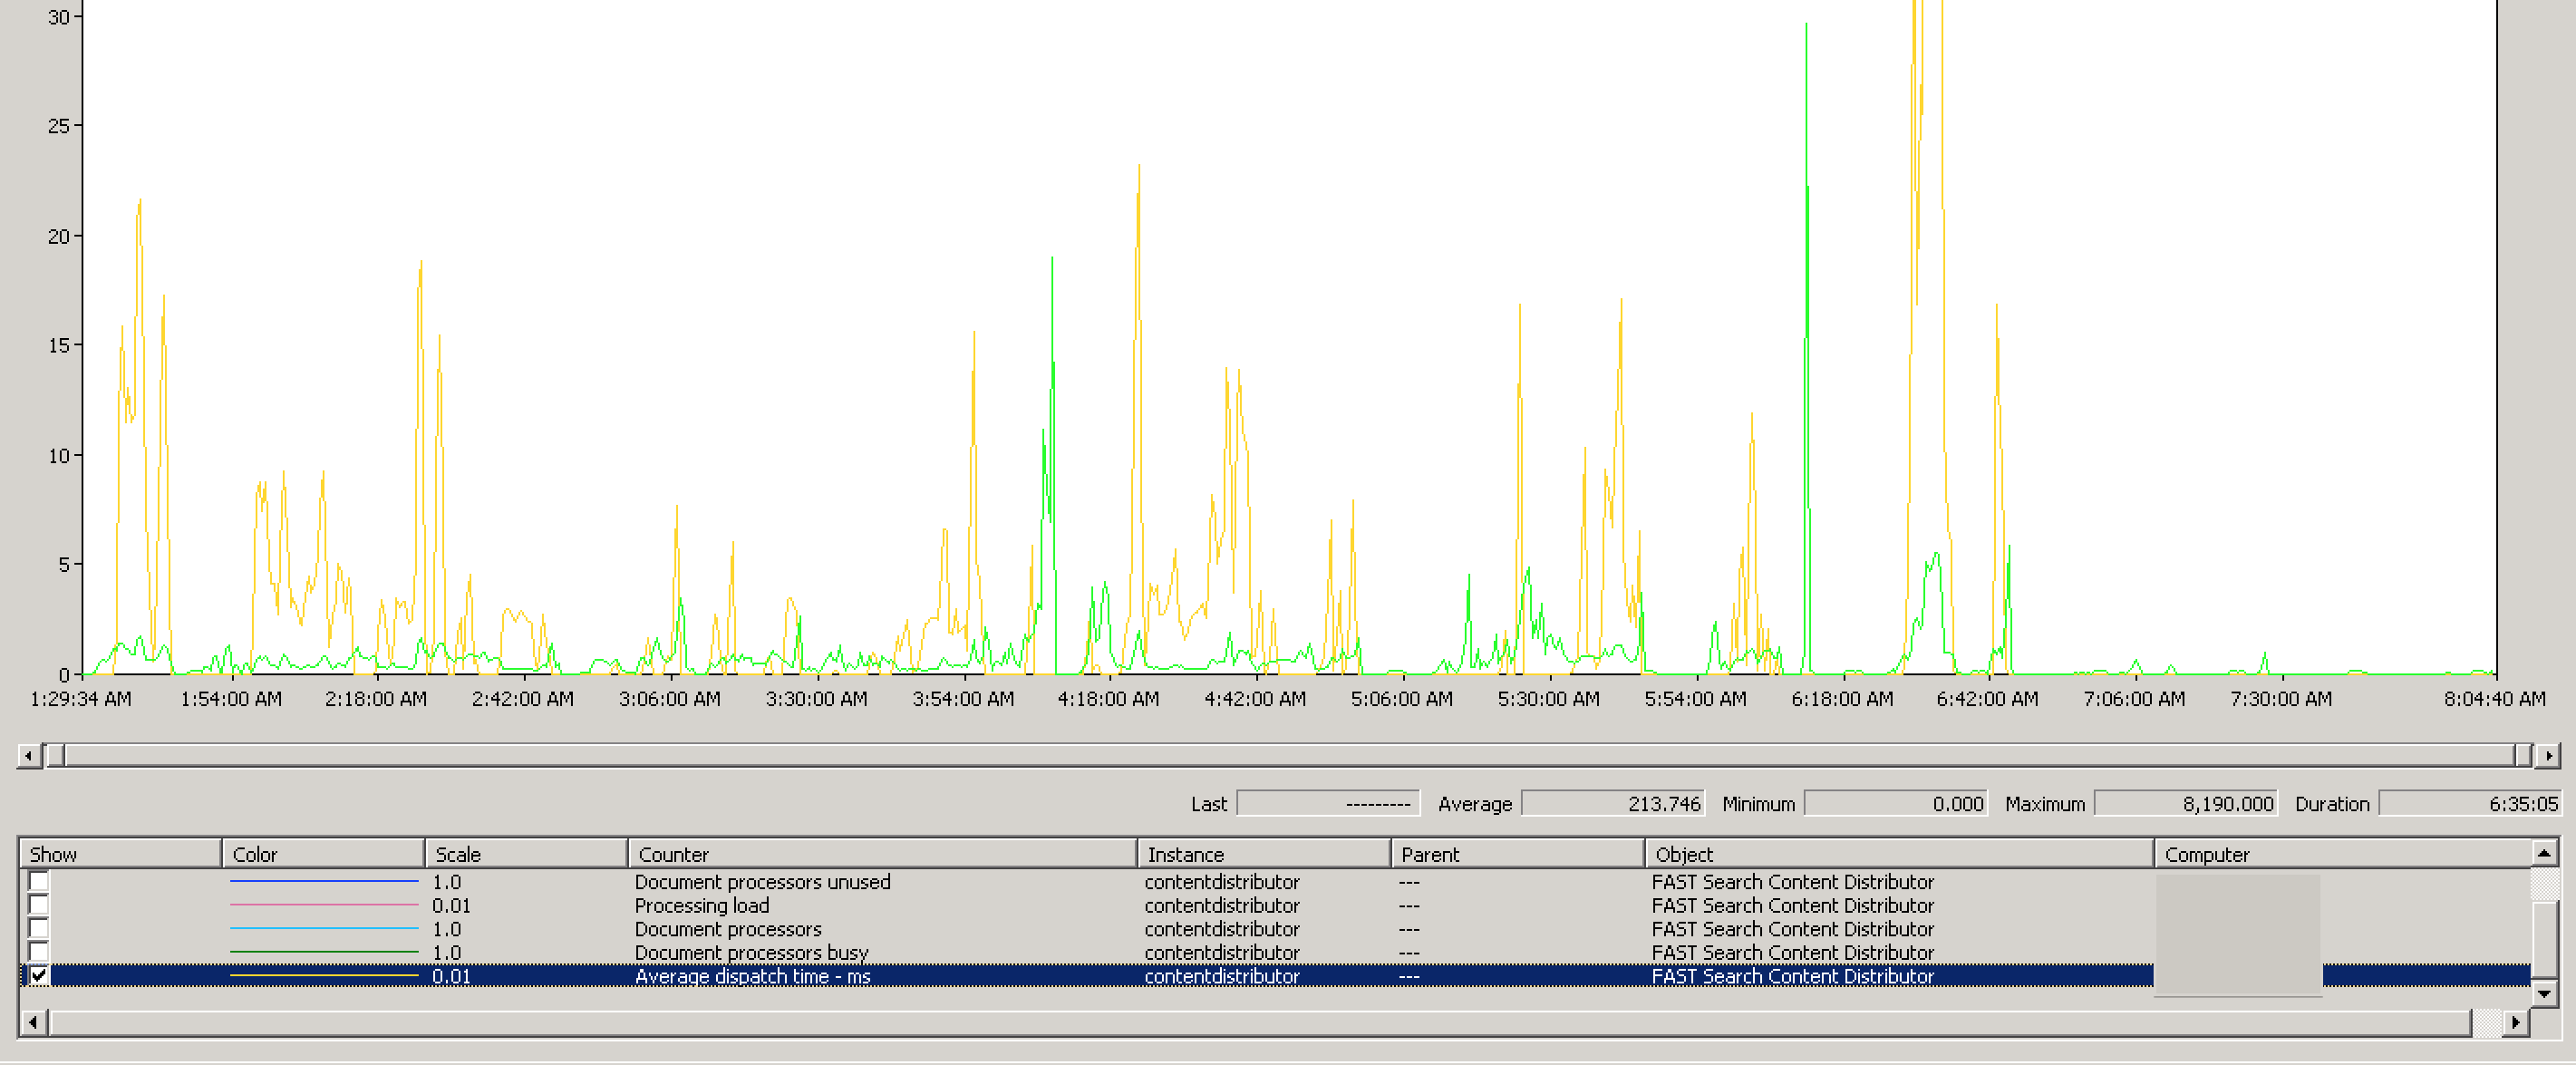
The average dispatch times were much lower. The peak was still unacceptable (at 8190ms), but you can see that was a rather odd fluke in our measurements. There may have been some other blocking process or anomaly in the network to cause this dispatch time, as the overall average is significantly lower than the max: 213ms. This is still outside of the recommended range Microsoft states (10ms), but is still significantly lower than our previous result.
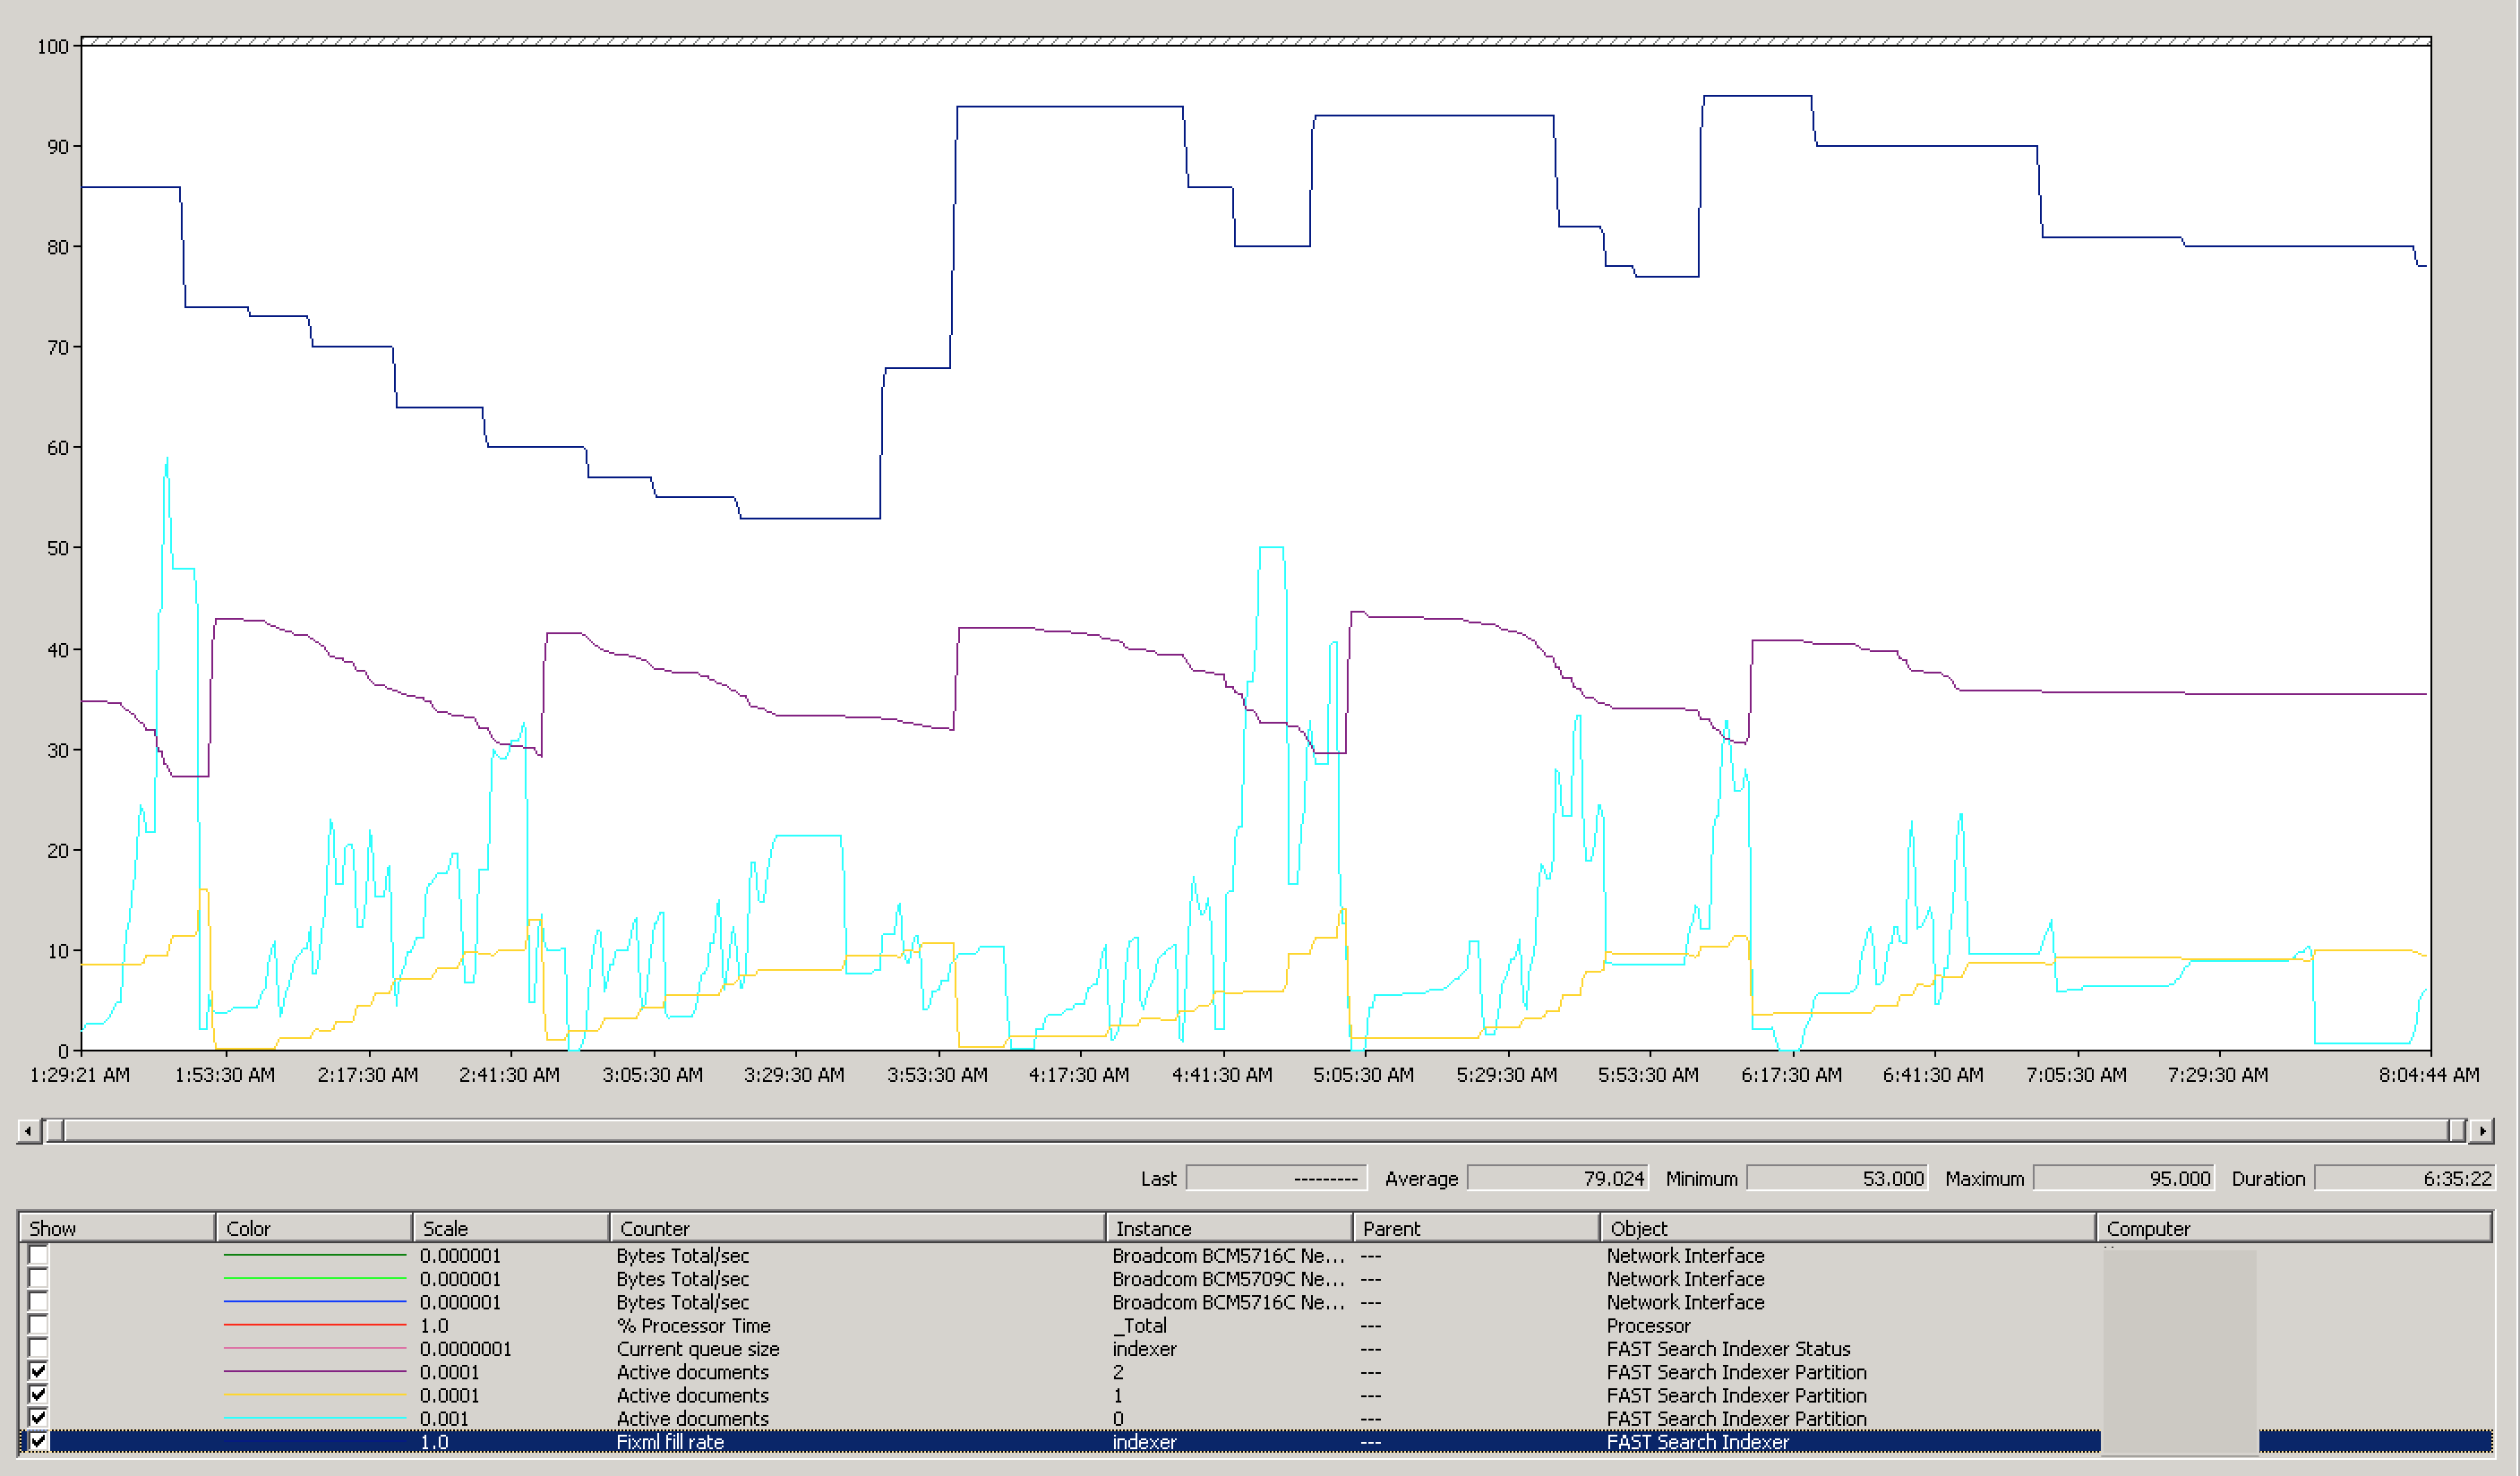
Ultimately, the last thing to check was how the index servers responded to these updates. If we look at the processor metrics alone, you can see that the processor was finally being more fully utilized. Although these performance graphs barely show 100% utilization, the live graphs were almost peaking at 100% constantly:
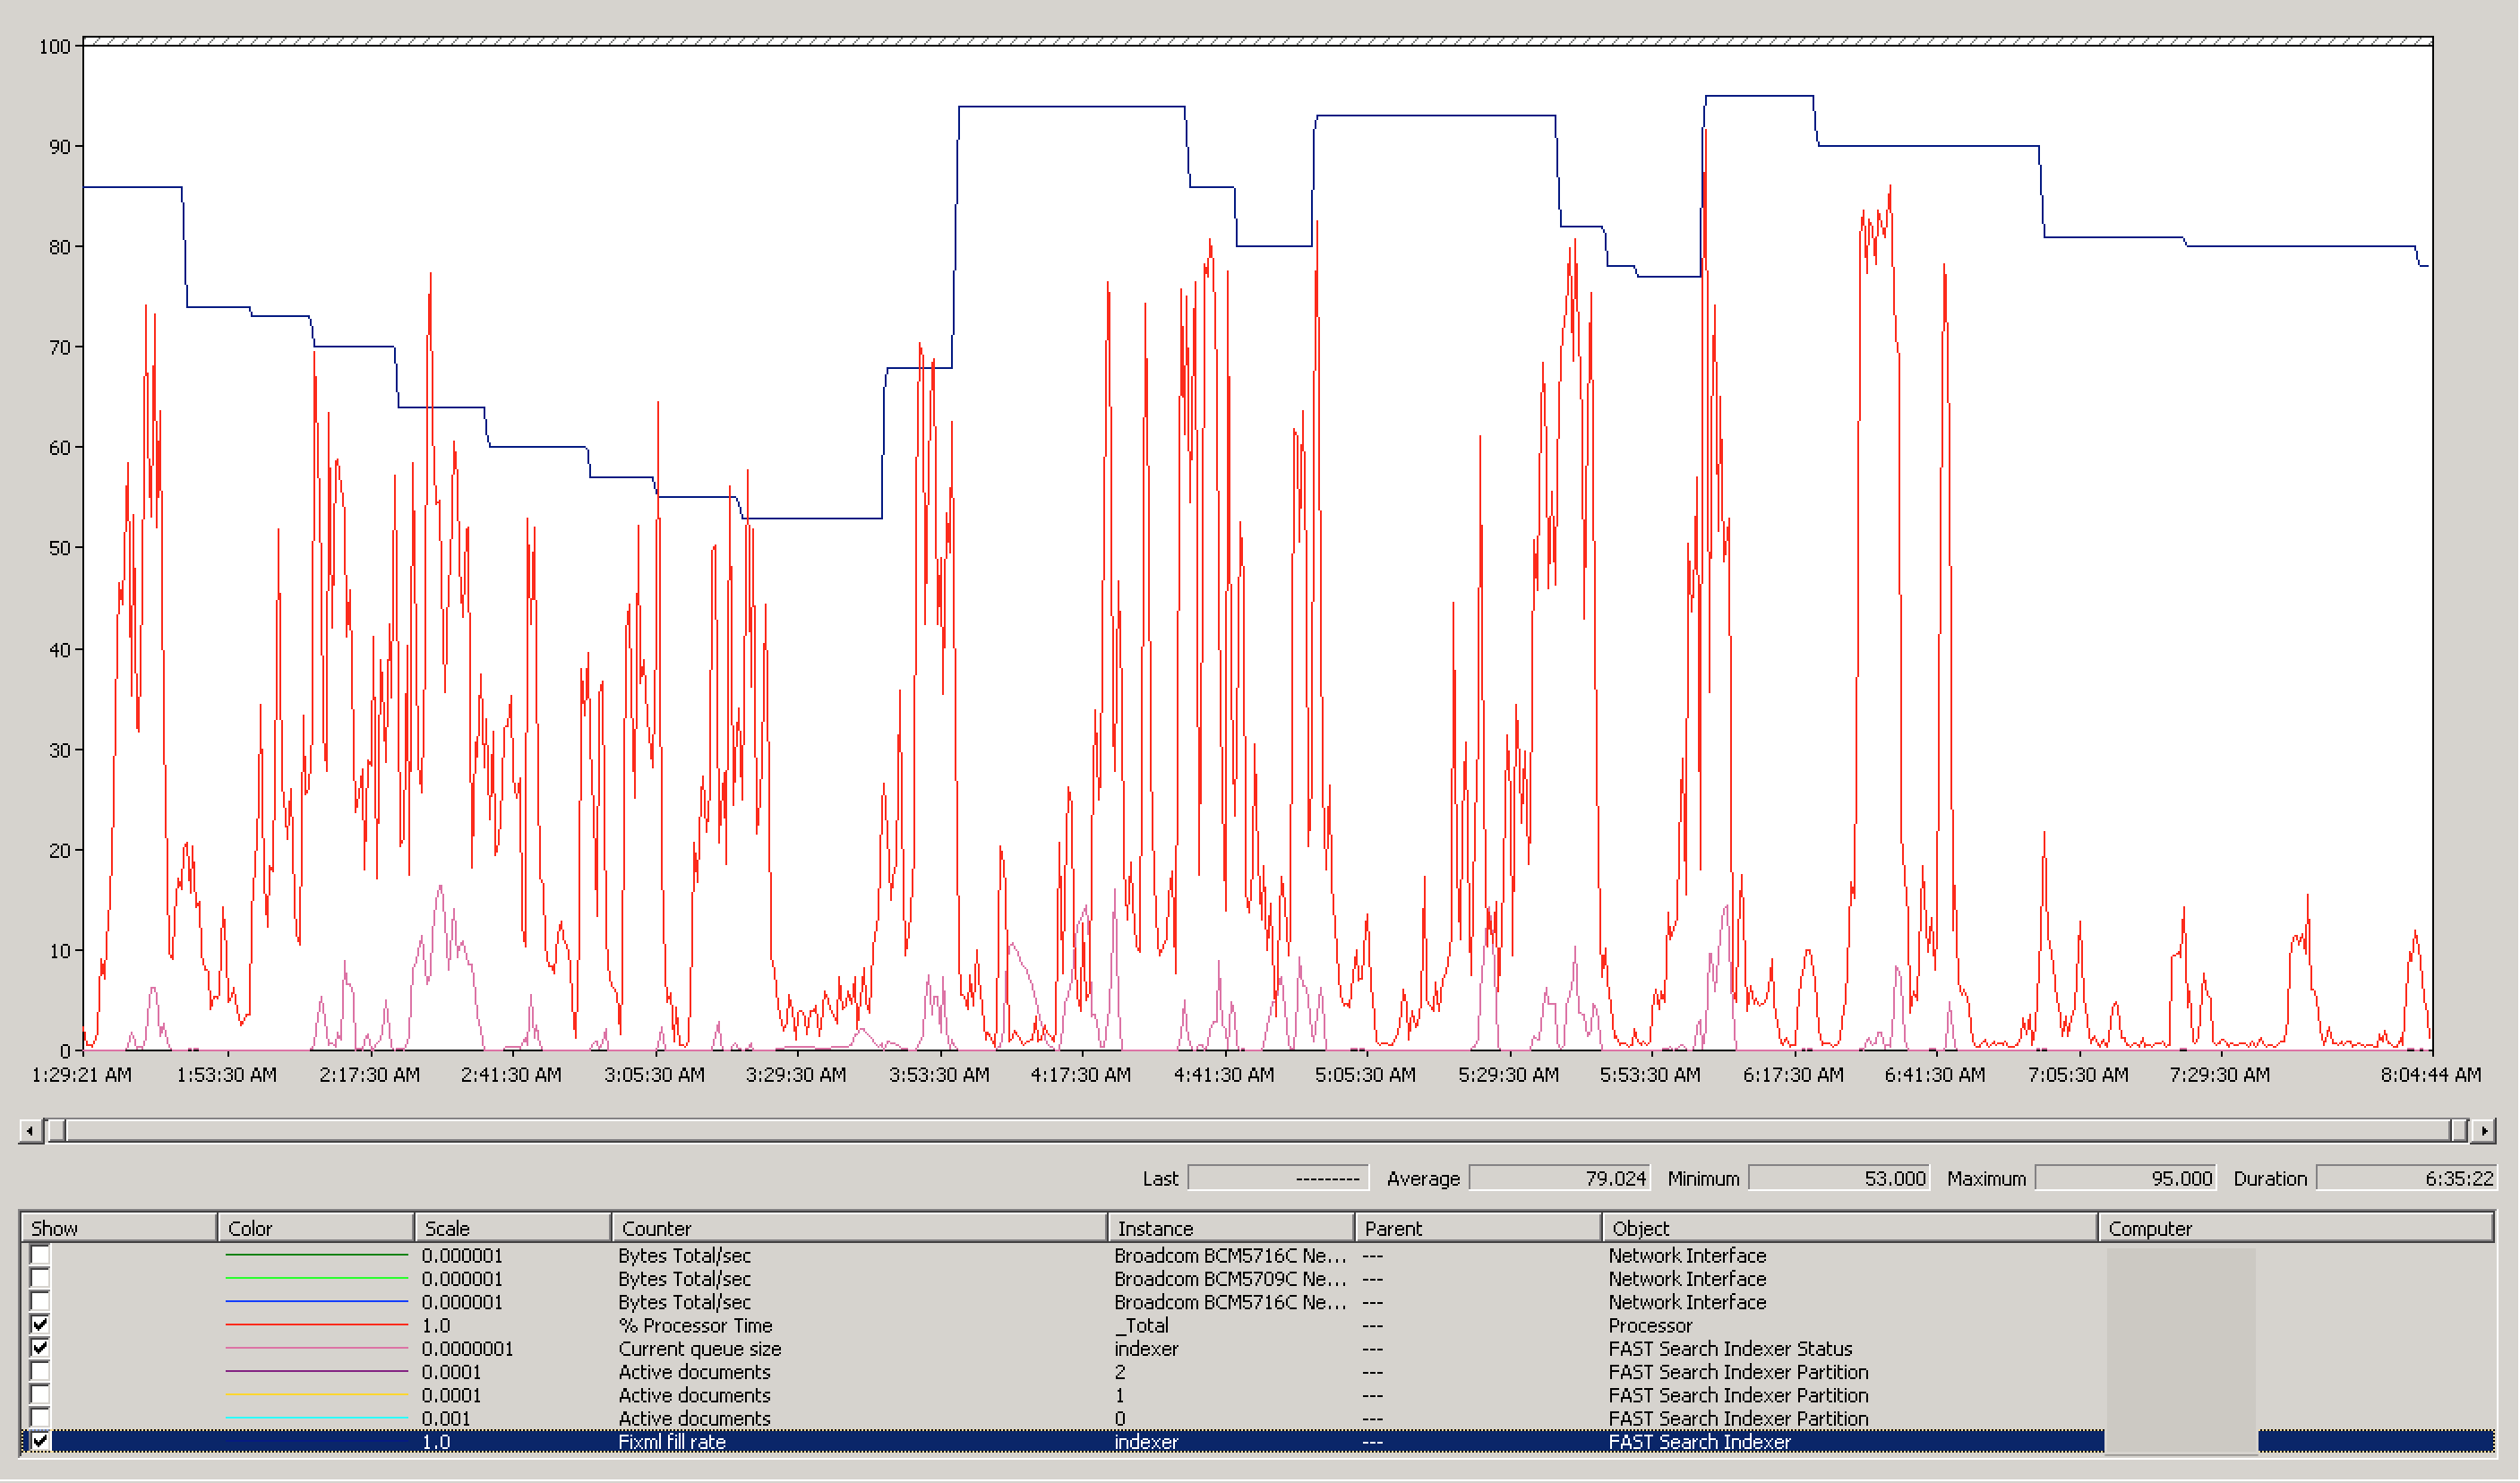
But although the processor is a good metric of how utilized the server is, what’s more important to determine that the indexers have sufficient amount of data to work against, is the FiXML rate. When we look at that, we see the rate is largely above 75%, the threshhold Microsoft recommends is necessary for a “healthy” FAST indexing envrionment:
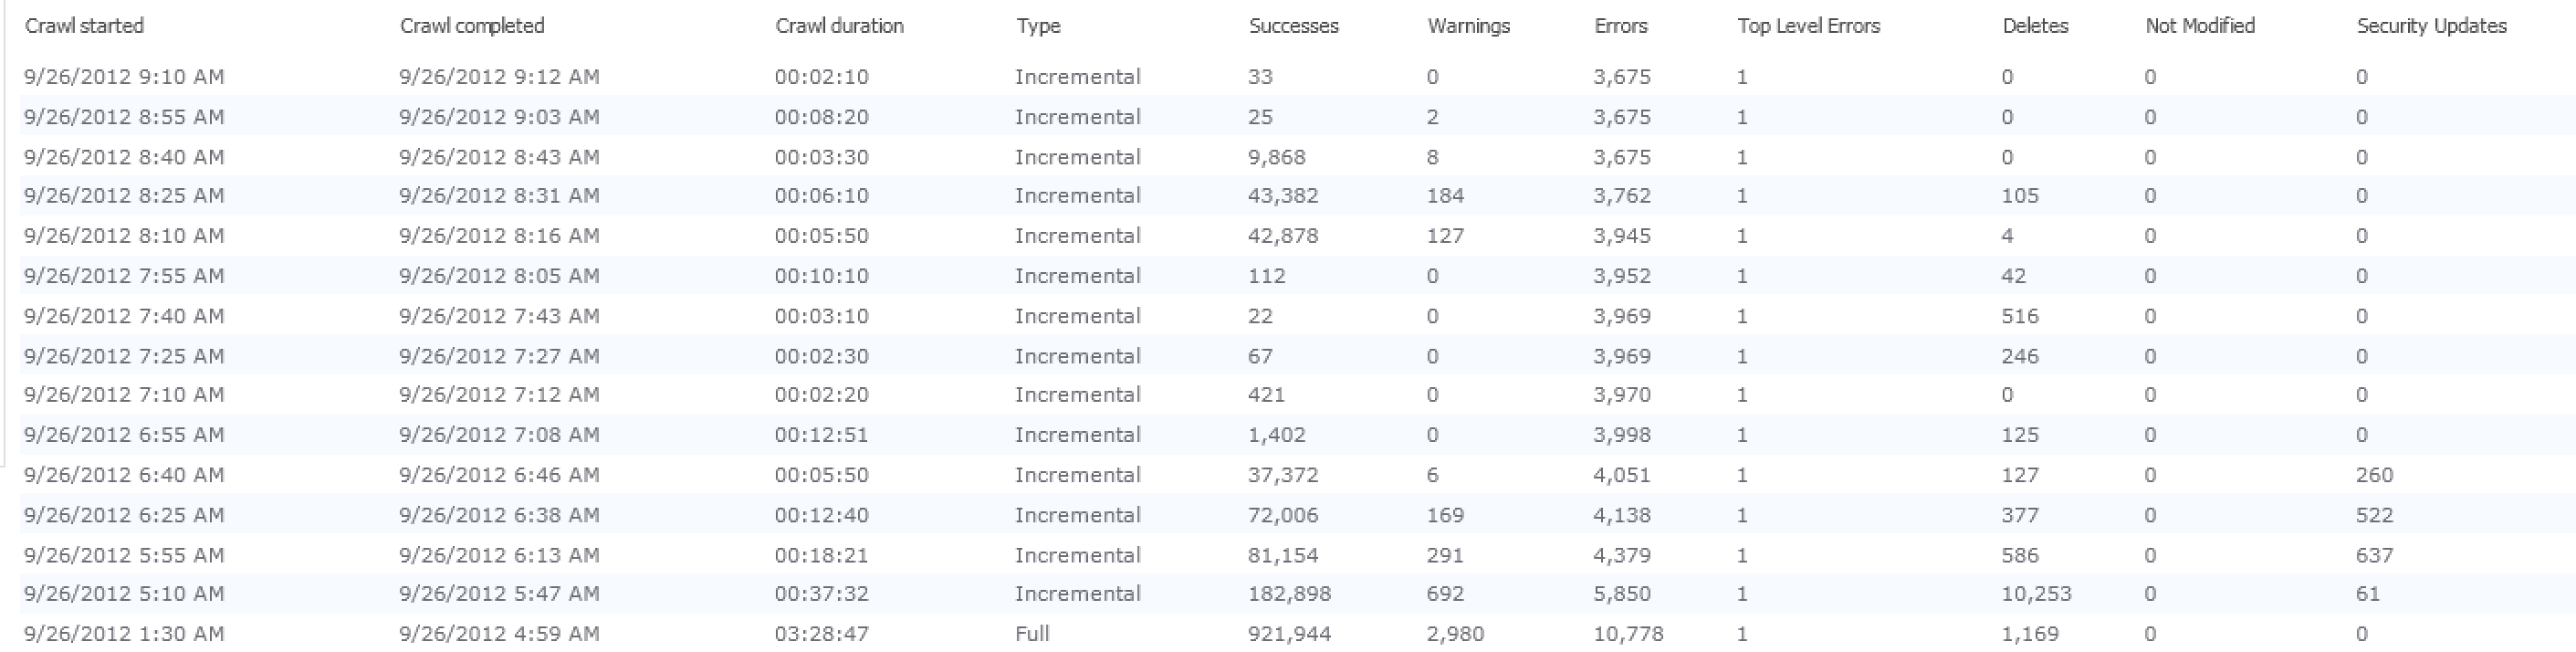
Looking at our crawl times now, I’m much happier to see incremental crawls taking less than 10 minutes a piece, even when indexing 40K+ items:
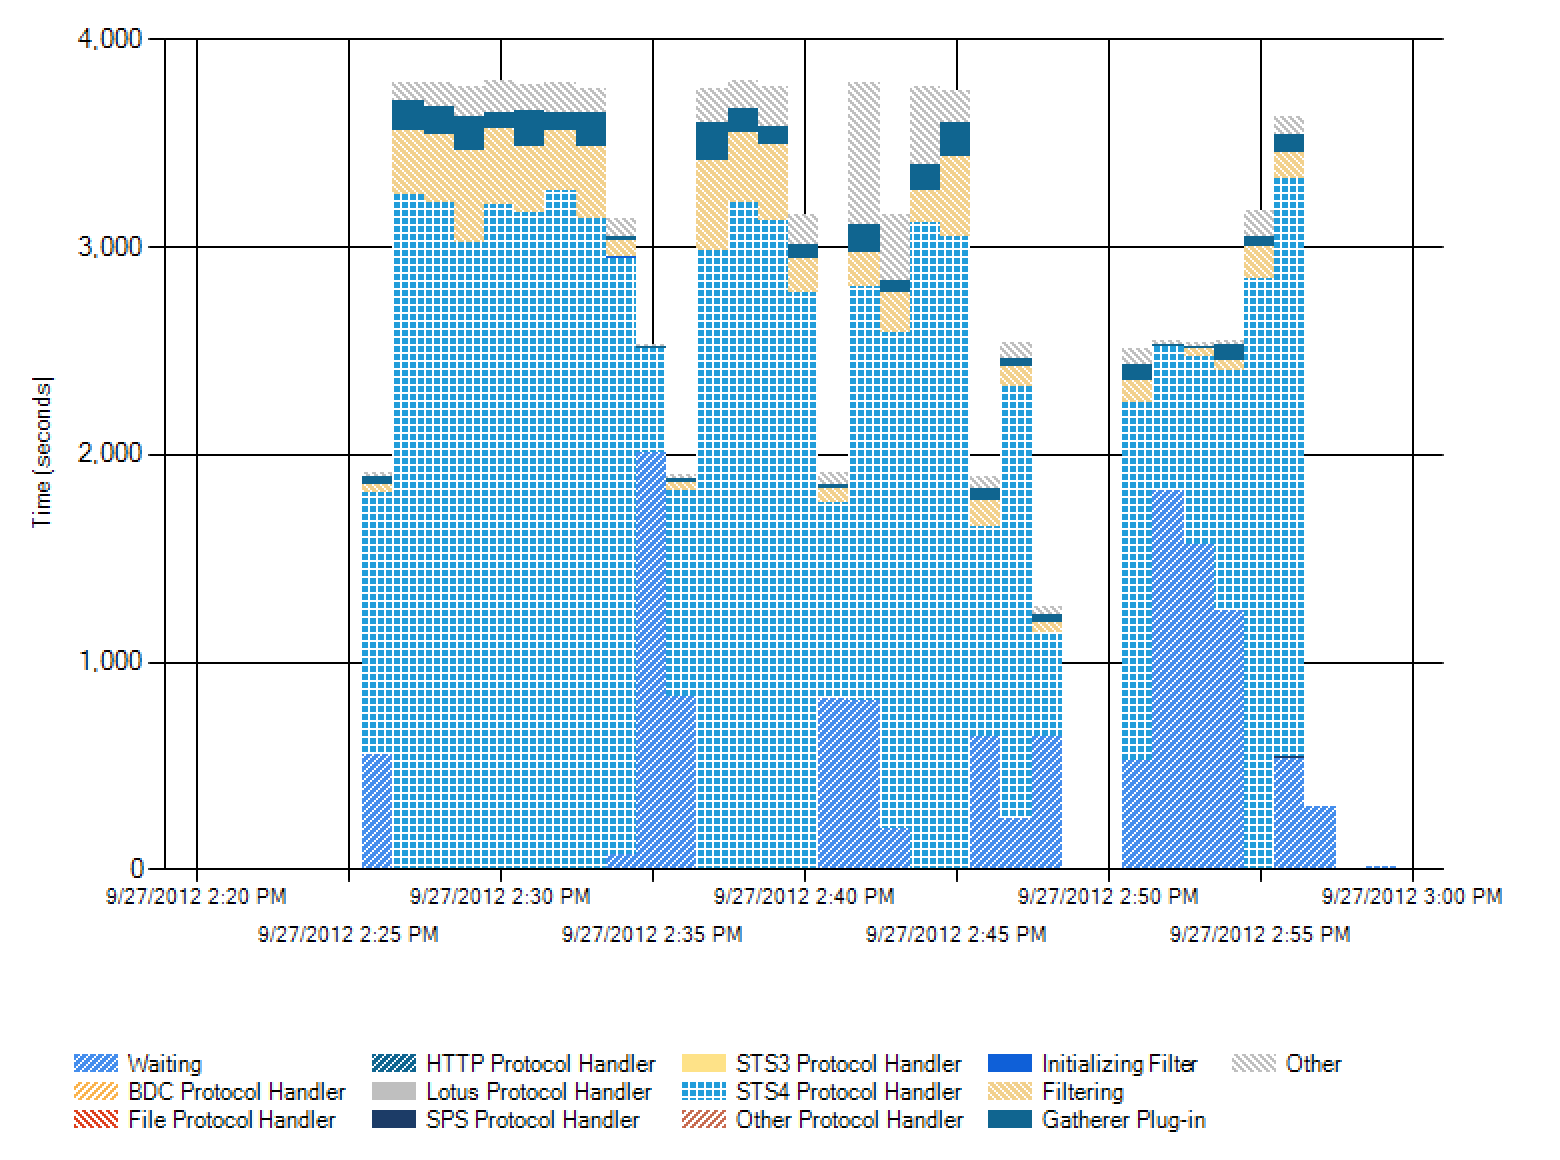
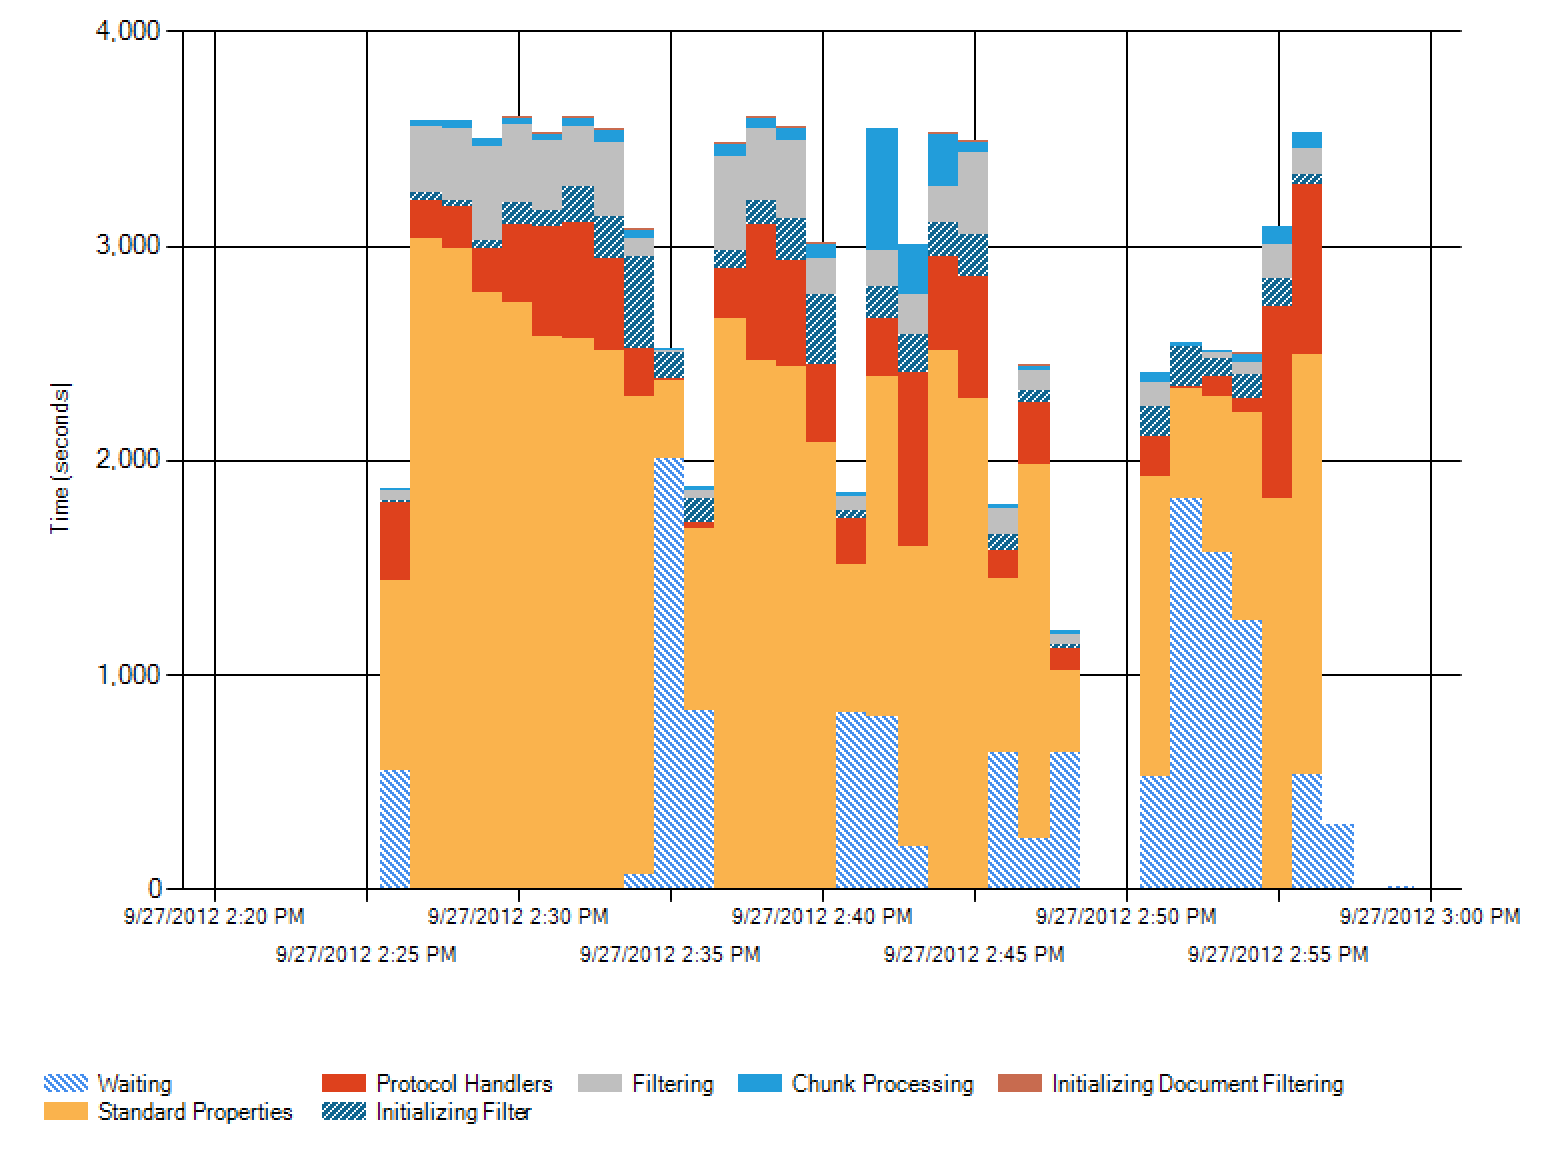
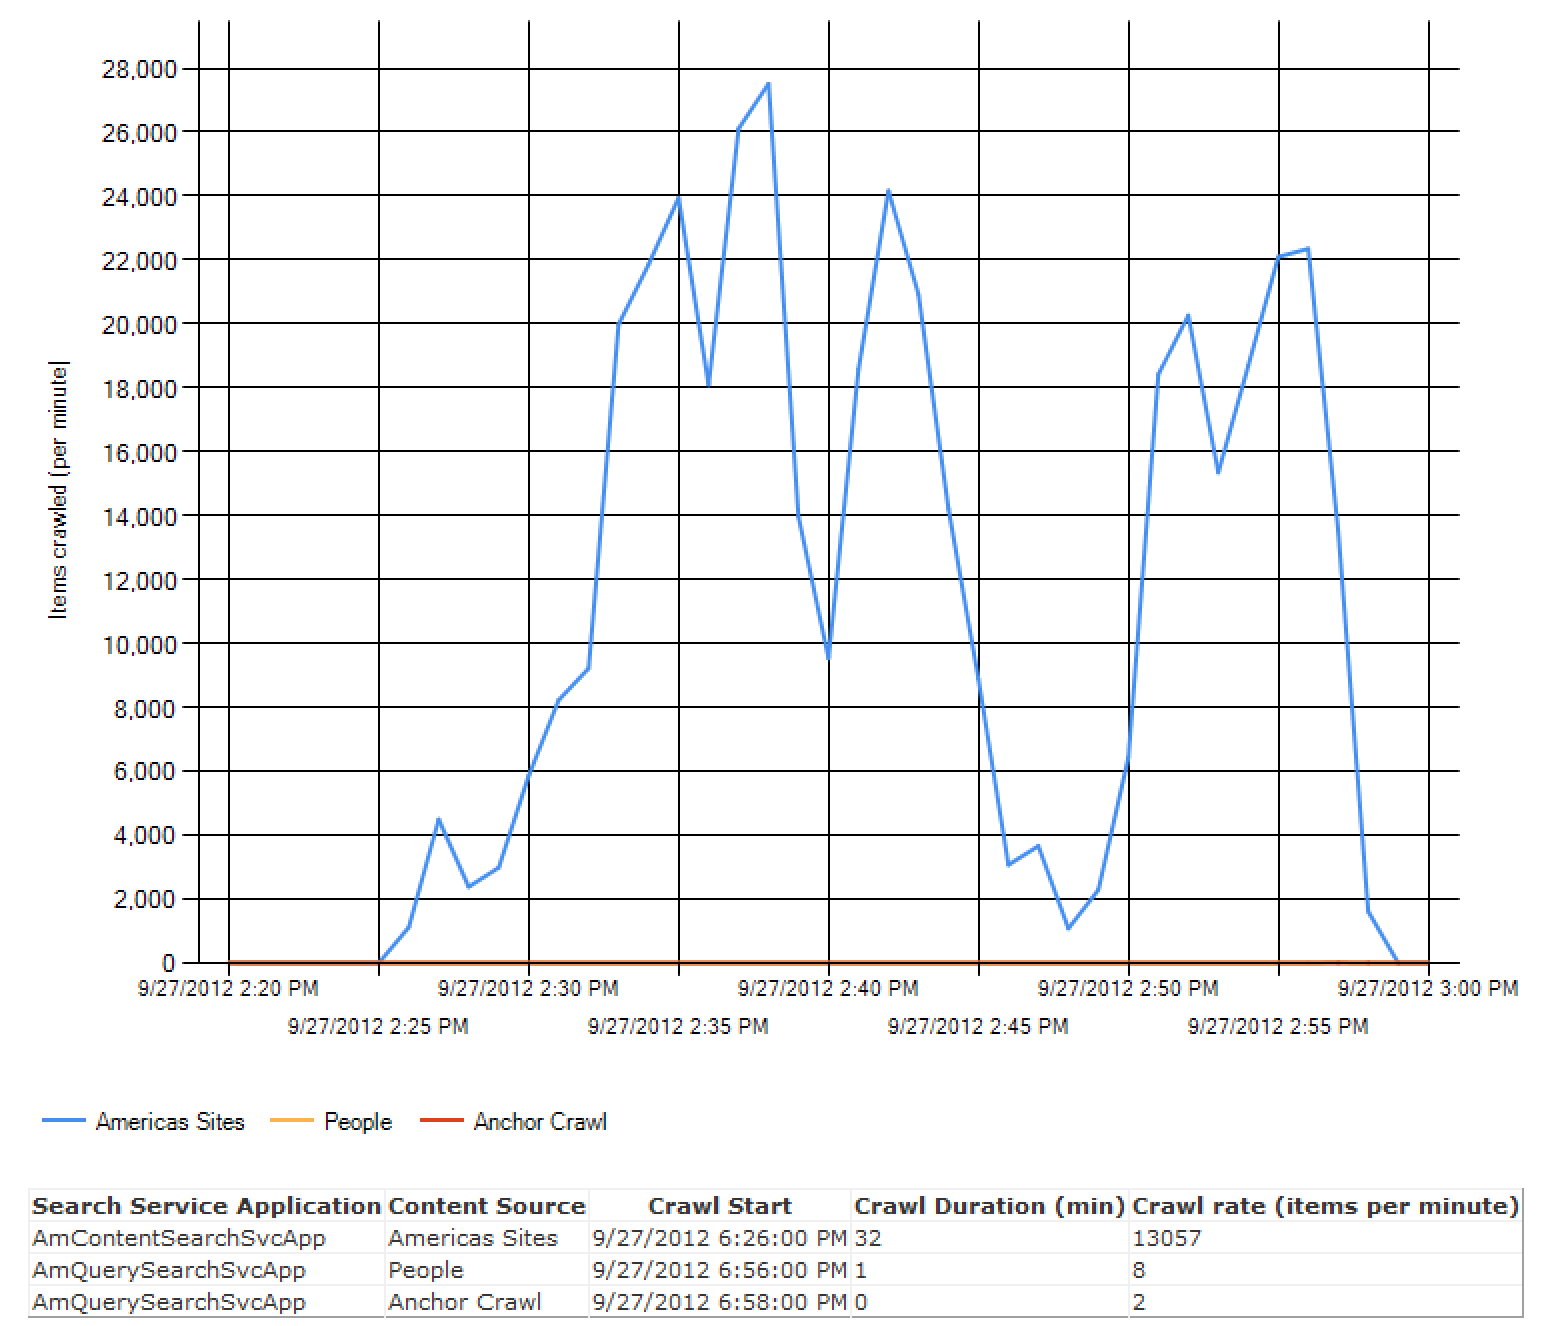
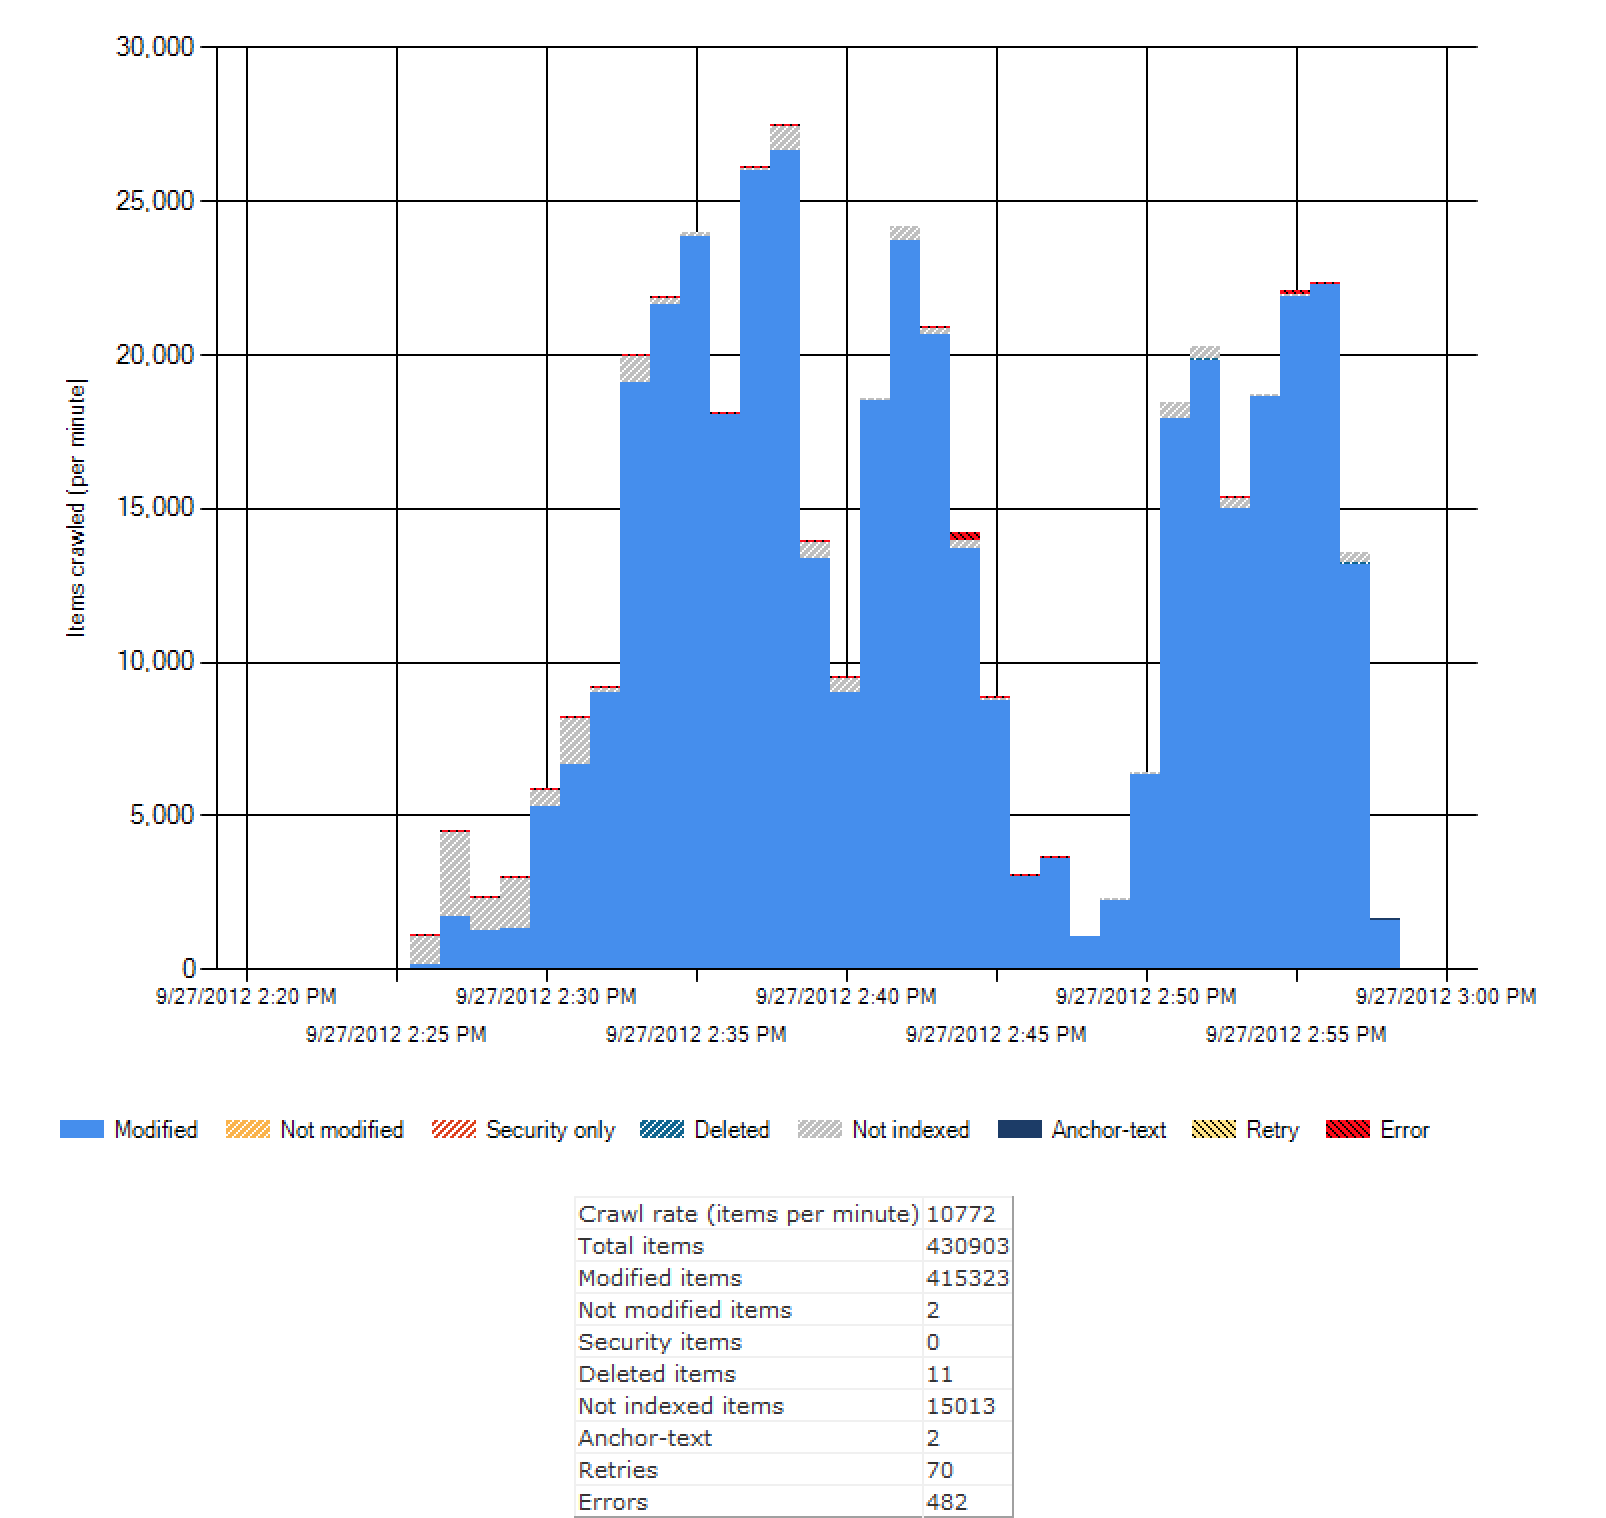
Admin Reports and Conclusion
In short, troubleshooting this issue was no walk in the park. FAST is not an easy system to understand. Throwing SharePoint into the mix (which is just as large and difficult) only makes matters worse. However, by paying close attention to the details and studying how your system is behaving, you’ll eventually find what you’re looking for.
<rant> Finding the information on what to look for, though, can be just as challenging. I found that things really started to take off for me only after I started reading the Microsoft FAST book. TechNet had the required documentation that I needed to understand how to diagnose the problem. Yet, I found that finding information on TechNet was extremely challenging. For a product that can cost in the tens of thousands of dollars for just a small environment, I’d really like to see Microsoft invest some time in really understanding how end users look through their documentation, and really improve it. The “auto-hiding” links in the navigation heiarchy on the left of the page suck. What sucks even more? Not having an automatically expandable hierarchy so I can browse the hierarchy of contents. The fact that it would take me 15-20 clicks to get to the bottom of the FAST documentation is absurd - I should be able to have a full ToC - not a ToC at every major section all the way to the bottom of the stack. </rant>
I leave you with these wonderful Administrative Report graphs, just because I think they’re actually really useful bits of information, though I don’t feel like diving in to explain all of these.